Menu Guide
Report #
New #

Creating a new empty report with only the data source item. After that you can add more process and visualization items.
Open #
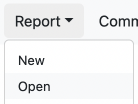
Show a dialog to open an existed and saved report with saved data source, process, and visualization codes.
Open Recent #
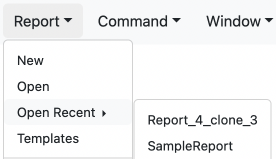
Quickly open a recently opened report of the current session.
Save #
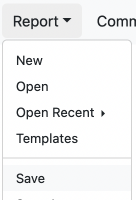
Save the current new or edited report.
Save As #
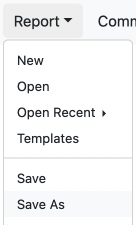
Save the current report as another report.
Save All #
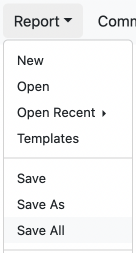
Save all currently opened reports including new or edited ones.
Close #
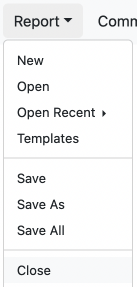
Close the current report. Will ask for saving if it's new or edited.
Close All #
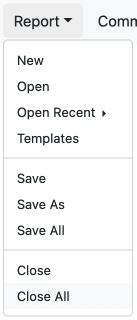
Close all current reports. Will ask for saving new or edited reports.
Command #
Preview All #

Automatically ajax request and show previewed data and widgets of all process and visualization items.
Show All Codes #
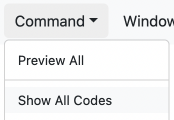
Show the code tab of all process and visualization items.
Show All Data/Widgets #
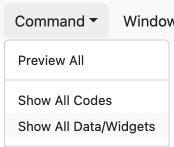
Show the data or widget tab of all process and visualization items.
Empty Report #
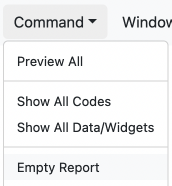
Clear code content of all data source, process, visualization items of the the current reports.
Reset Report #
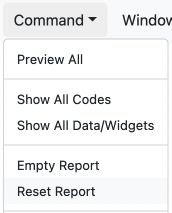
Reset code content of all data source, process, visualization items of the the current reports to the last saved state.
Export Codes #
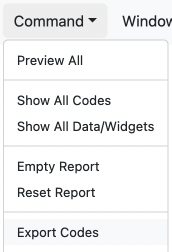
Export the current report to report source code files in structured format to be downloaded.
Import Codes #
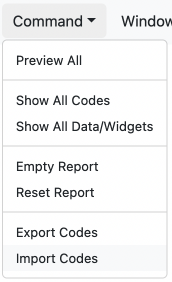
Upload and import report source code files with structured format to the current report.
Window #
Hide #

Hide the current report and show the default blank window.
Last notification #
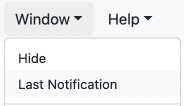
Show the app's last notification.
< Report name > #
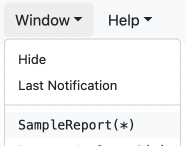
Switch to the clicked report.
Help #
Documentation #

Show Codegen app's documentation in the docs/example pane.
Menu Guide #
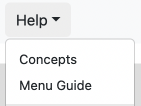
Show Codegen app's menu guide in the docs/example pane.
Tutorials - Creating Report #
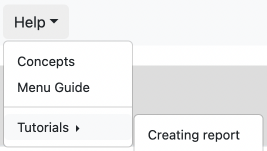
Show creating report tutorial in the docs/example pane.
Get started with KoolReport
KoolReport will help you to construct good php data report by gathering your data from multiple sources, transforming them into valuable insights, and finally visualizing them in stunning charts and graphs.