Concepts
App #
CodeGen app is used for creating new reports, editing existed ones based on available templates.
App panes #
The app window is splitted into a left-side report pane and a right-side docs/example pane.
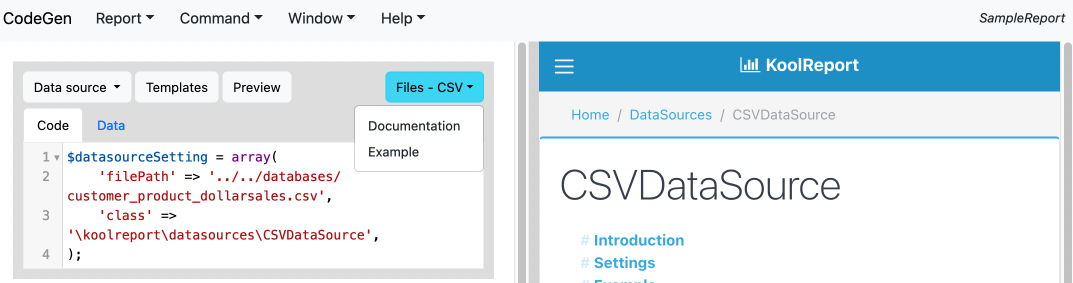
When users click on an item's dropdown's documentation or example menu, the docs/example pane will display the item docs/example.
The divider between the two panes could be dragged to change the panes' width.
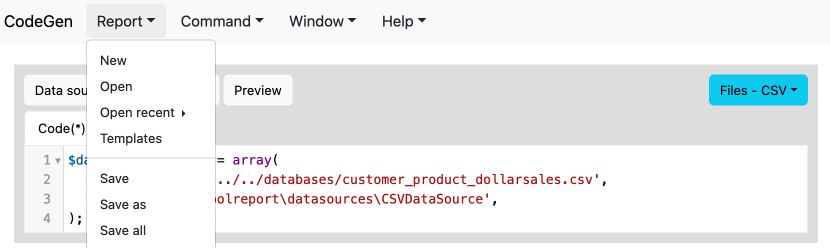
Report #
A report pulls data from a data source, processes it by modifying, summarizing, grouping, etc, and visualizes processed data.
Each report consists of one data source item and zero or multiple process and visualization items.
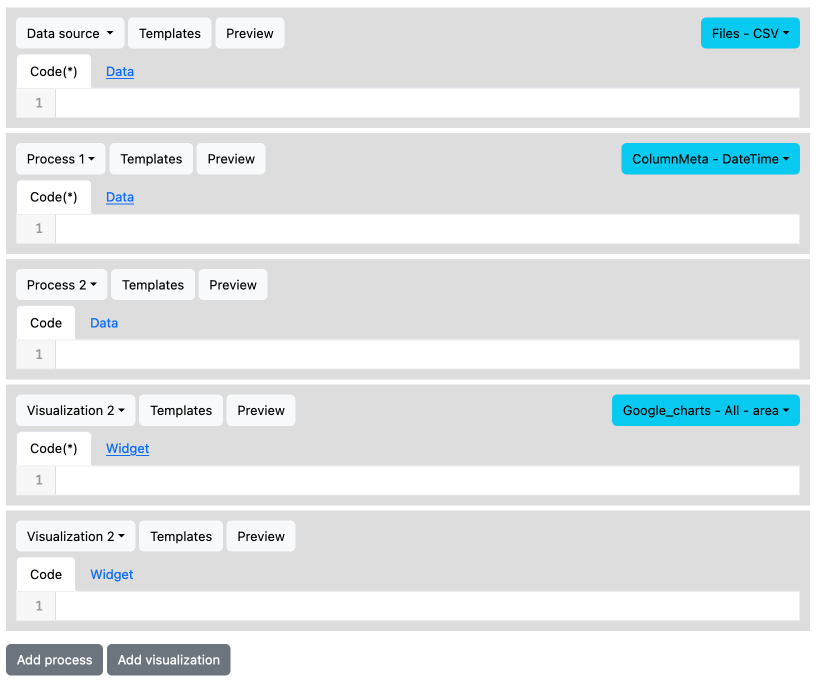
The process and visualization items are sortable by dragging and dropping each item. Only is the data source item fixed and it must be at the beginning of a report.
The data source item pulls data from any type of data such as files, databases, variables, etc.
Each process item receives data from the last process (or data source) before it and outputs its processed data to the next process or visualization item.
Each visualization item receives data from the last process (or data source) before it and outputs a visualized widget in table, chart, pivot, etc form.
Data source #
For a report to have output it must have at least one data source input. Multiple data sources could make report structure complicated. Therefore, a newly created report always starts with exactly one item called data source to pull data from.
Users can enter data source setting code directly into editor or choose one template from available templates and edit the code.
A Preview dropdown menu is used to check the retrieved data.


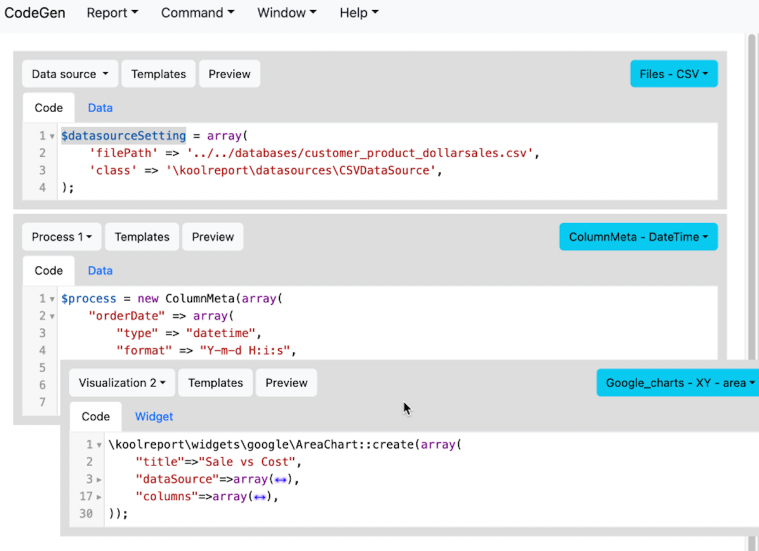
A data source item's code must be a statement that defines a variable called $datasource:
$datasource = ...
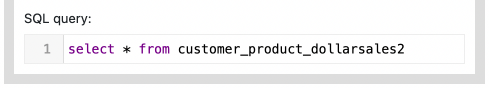
If your data source setting is of relational database type, there needs to be a SQL query as well to retrieve data from the sourced database:
If your data source setting is of report type, there needs to be a datastore name as well to retrieve data from the sourced report. The name should be formatted as "result_< number >" where < number > is the data result of process < number > of the sourced report:

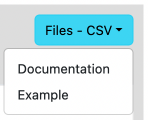
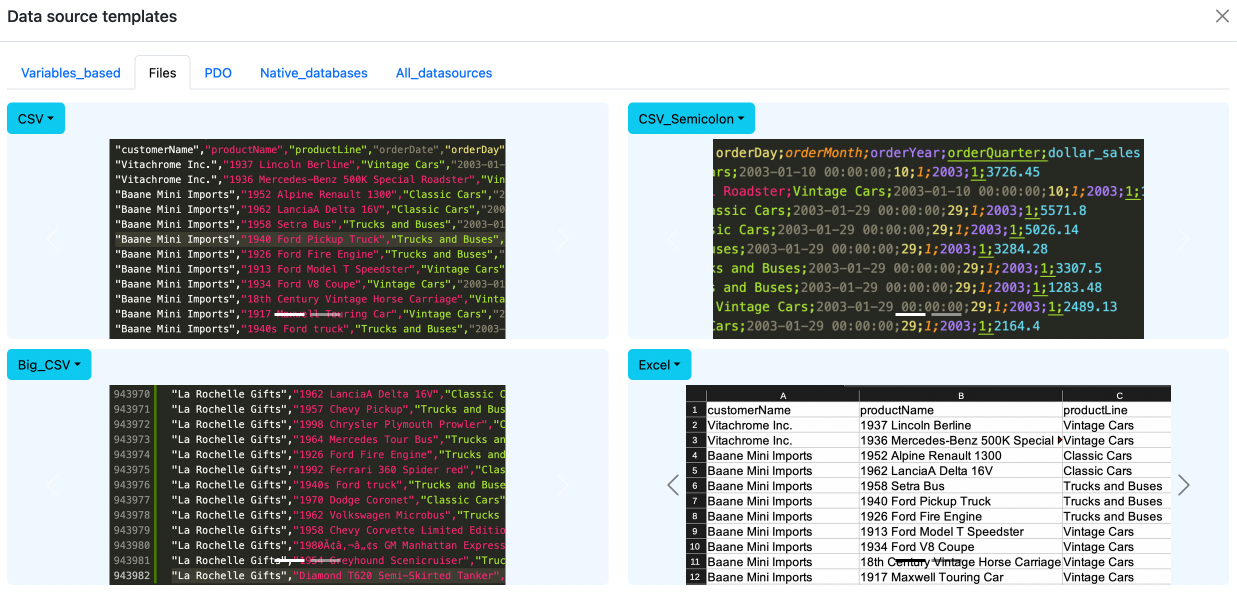
Data source item could be one of KoolReport's multiple data source types:
On the top right corner of the data source item there is a dropdown indicating the last template which is copied into the item's editor.
Processes #
At any point after the data source item, users can add any number of processes. Each process receives the data of the last process (or data source) before it as input and applies processing code to generate its output data.
Users can enter processing code directly into editor or choose one template from available templates and edit the code.
A Preview dropdown menu is used to check the processed data.


A process item's code must be a statement that defines a variable called $process:
$process = ...
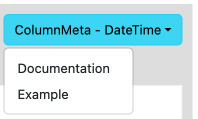
On the top right corner of a process item there is a dropdown indicating the last template which is copied into the item's editor.
Visualizations #
At any point after the data source item, users can add any number of visualizations. Each visualization receives the data of the last process (or data source) before it as input and applies visualization code to generate its output widget.
In case users want to use a different data, they can edit the dataSource property to be an array other than the default $this->dataStore('result'):
\koolreport\apexcharts\BarChart::create(array(
  "dataSource" => $this->dataStore('result'), // default data of the last process or data source
  ...
));
\koolreport\apexcharts\BarChart::create(array(
  "dataSource" => array(...),
  ...
));
Users can enter visualization code directly into editor or choose one template from available templates and edit the code.
A Preview dropdown menu is used to check the visualized widget.


A visualization item's code must be a statement that creates a KoolReport widget:
\koolreport\widgets\google\AreaChart::create(...);
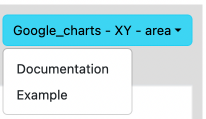
On the top right corner of a visualization item there is a dropdown indicating the last template which is copied into the item's editor.
Templates #
For each type of data source, processs, or widget items, there are templates which are a collection of example codes. It is shown when users click on Templates buttons, copied into editor when users double click on each template screenshot or code.
Each individual template has the following parts.
Template name and menu:
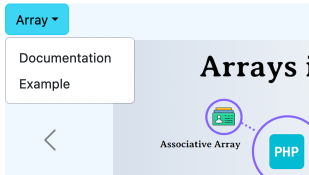
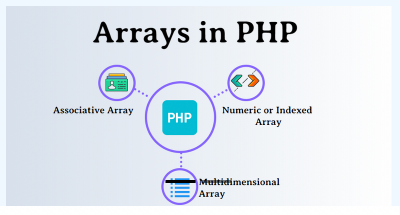
Template representative screenshot:
Template code:
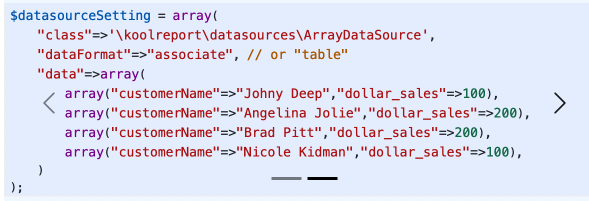
Users can double click on either a template's screenshot or code to copy its code into an item's editor.
Get started with KoolReport
KoolReport will help you to construct good php data report by gathering your data from multiple sources, transforming them into valuable insights, and finally visualizing them in stunning charts and graphs.