KoolReport's Forum

Official Support Area, Q&As, Discussions, Suggestions and Bug reports.
Forum's Guidelines

Y-Axis labels for LineChart #623

Closed Eugene opened this topic on on Jan 28, 2019 - 4 comments

Eugene commented on Jan 28, 2019

Hi,

I have some data see pic:

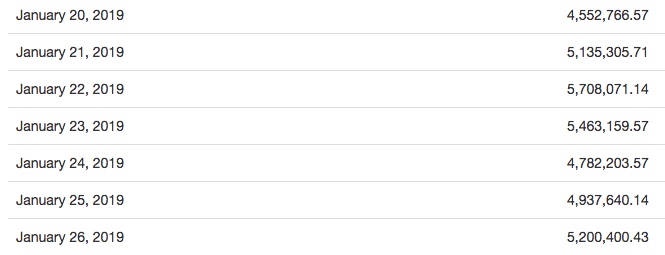
But if I create a line chart the Y-Axis labels are not the millions

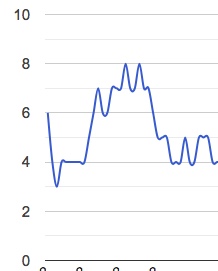
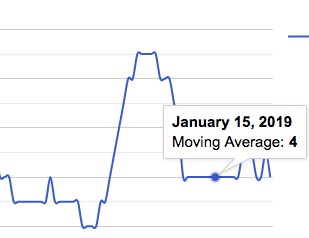
I have not found any way to control it

My code for chart:

 LineChart::create(array(
            "title" => "Moving average chart",
            "dataSource" => $this->dataStore('movingAverage'),
            "columns" => array(
                "date",
                "movingAverage" => array(
                    "label" => "Moving Average",
                    "type" => "number",
                ),
            ),
            "options" => array(
                "curveType" => "function"
            )
        ));
KoolReport commented on Jan 28, 2019

Could you please send us your page through email, I would like to see, coz the issue seems strange and I could not able to reproduce.

Eugene commented on Jan 28, 2019

done

KoolReport commented on Jan 28, 2019

That's strange! What I have seen from your page source is that data is from server. I wonder if you have any data transformation before putting to the chart. Or it is because that the movingAverage is not in number type but in string type, for example "4,244,444" so when this is parsed to number, it results to 4. Could you please check if the real type of movingAverage.

Eugene commented on Jan 28, 2019

Yap, thanks. It was because of the SQL format function in the select query.

Build Your Excellent Data Report

Let KoolReport help you to make great reports. It's free & open-source released under MIT license.

Download KoolReport View demo
help needed

None