KoolReport's Forum

Official Support Area, Q&As, Discussions, Suggestions and Bug reports.
Forum's Guidelines

Implement Table Heatmap #339

Open Keith Burke opened this topic on on Jun 28, 2018 - 3 comments

Keith Burke commented on Jun 28, 2018

Hi,

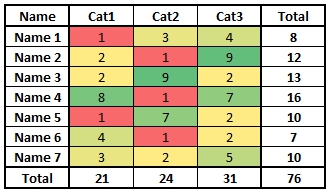
Would you consider implementing something like a Table [or datagrid] Heatmap feature similar to https://codepen.io/bryceyork/pen/mtqAl

I use Heatmaps all the time in Excel but if I could do them in CSS / web, then I don't need to touich Excel for management reports.

David Winterburn commented on Jun 28, 2018

Hi Keith,

This is quite interesing! Would you please describe how to you config for such table headmap in Excel (i.e: color range, number threshold, etc)?

Keith Burke commented on Jun 28, 2018

Ha. No idea. I just let Excel do it in the Conditional Formatting. It looks quite well. Here's a sample below.

Basically, I select all cells that I want included in the heatmap, then select Conditional Formatting in the Ribbon Bar, and choose one of the Color Scales

I've no idea how you would implement it in CSS but the link I added earlier seems to be close. [I'm not a web designer nor expert in css]

Keith Burke commented on Jun 28, 2018

I've just noticed the DataGrid control. I'll no longer use Tables. Please implement HeatMap in the DataGrid :)

Build Your Excellent Data Report

Let KoolReport help you to make great reports. It's free & open-source released under MIT license.

Download KoolReport View demo
suggestion

None