KoolReport's Forum

Official Support Area, Q&As, Discussions, Suggestions and Bug reports.
Forum's Guidelines

Sorting problem #3175

Open Adolfo Alonso opened this topic on on Oct 18, 2023 - 5 comments

Adolfo Alonso commented on Oct 18, 2023

Hi, please take a look at my code, I want to sort the ColumnChart.

Also, how would I color the columns that sum to the 80% of the total? Trying to make comething like a pareto chart.

MyReport.php

<?php
	// Require autoload.php from koolreport library
	require_once "../../koolreport/core/autoload.php";
	use \koolreport\processes\Sort;
	
	//Step 2: Creating Report class
	class MyReport extends \koolreport\KoolReport
	{
		use \koolreport\amazing\Theme;
		use \koolreport\inputs\Bindable;
		use \koolreport\inputs\POSTBinding;
		
		
		protected function defaultParamValues()
		{
			return array(
				"dateRange"=>array(
					date("Y-m-d", strtotime('-7 days')) . " 00:00:00",
					date("Y-m-d", strtotime('-0 days')) . " 23:59:59"
				),
				"customers"=>array(),
			);
		}
		
		protected function bindParamsToInputs()
		{
			return array(
            "dateRange"=>"dateRange",
            "customers"=>"customers",
			);
		}
		
		public function settings()
		{
			return array(
            "dataSources"=>array(
			),
            )
			);
		}
		public function setup()
		{
			$this->src('automaker')
			->query("SELECT
					e.conductor AS conductor, 
					(SELECT descripzam FROM cat_sucursales WHERE sucursalid = e.sucdriverid) AS sucursal,
					SUM(CASE
					  WHEN speedgeo BETWEEN 80 AND 85 THEN 1 ELSE 0 END
					) AS '81 - 85',
					SUM(CASE
					  WHEN speedgeo BETWEEN 86 and 90 THEN 1 ELSE 0 END
					) AS '86 - 90',
					SUM(CASE
					  WHEN speedgeo BETWEEN 91 and 95 THEN 1 ELSE 0 END
					) AS '91 - 95',
					SUM(CASE
					  WHEN speedgeo BETWEEN 96 and 100 THEN 1 ELSE 0 END
					) AS '96 - 100',
					SUM(CASE
					  WHEN speedgeo BETWEEN 101 and 105 THEN 1 ELSE 0 END
					) AS '101 - 105',
					SUM(CASE
					  WHEN speedgeo > 106 THEN 1 ELSE 0 END
					) AS '> 106',
					COUNT(speedgeo) AS total
					FROM tbl_geo_eventos_hist e
					INNER JOIN tbl_conductor c on c.idgeo = e.driver
					INNER JOIN cat_sucursales s ON s.sucursalid = c.sucursalid
					WHERE e.activefrommx > :start
					AND	e.activefrommx < :end
					AND e.sucdriverid IN (18, 19, 23, 24)	##Exceso sucedio mientras en LINDE (18, 19, 23, 24)
					AND e.rule = 'aQbmuxZY4Nk-2j6CYh85sQQ' 	##Exceso de Velocidad
					AND c.estatus = 1 						##Este activo
					AND c.sucursalid IN (18, 19, 23, 24)	##Actualmente en LINDE
					AND c.conductorid NOT IN (0, 22)		##Quitar Fidel y Externo
					GROUP BY e.conductor, e.sucdriverid")
			->pipe(new Sort(array(
				"total"=>"desc"
			)))
			->params(array(
			":start"=>$this->params["dateRange"][0],
			":end"=>$this->params["dateRange"][1],
            ":customers"=>$this->params["customers"]
			))
			->pipe($this->dataStore('purchase_summary'));
		}    
	}	
Sebastian Morales commented on Oct 19, 2023

Pls describe the problem clearer, with screenshots if possible. How many columns are there in your data? How do you want to sort them?

Adolfo Alonso commented on Oct 20, 2023

Hello, This is what my chart looks like, its the number of overspeed events grouped by speed range per driver.

First I need to order the columns in descending order of the shown datasets, if a dataset is hidden or shown then the order needs to update.

Then I need to change the border color of the drivers which events add up to 80% of the total events, again of the shown datasets.

Take a look at my data, in this example dataset "81 - 86" is hidden, so its not taken into consideration:

  1. In column J im adding the events for the shown datasets, my columns are ordered descendin
  2. In column K im doing a acumulated sum
  3. In column L im dividing each accumulated value over the total shown events
  4. Lastly I add the percentages up to =<80%

The result would look something like this:

The Pareto principle states that for many outcomes, roughly 80% of consequences come from 20% of causes (the "vital few").

Sebastian Morales commented on Oct 23, 2023

You can use the following processes to get the table/datastore's data you want in your report's setup:

1 . Use CalculatedColumn process to get the Sum column of incidents:

https://www.koolreport.com/docs/processes/calculatedcolumn/

2 . Use the Sort process to order data rows by the Sum column:

https://www.koolreport.com/docs/processes/sort/

3 . Use the AggregatedColumn process to get the accumulated percentage column:

https://www.koolreport.com/docs/processes/aggregatedcolumn/

In your report view, when the datastore's data is available you can find out the row number where the 80% percentage starts:

//MyReport.view.php
$numberOfRows = $this->dataStore('data')->count();
$this->dataStore('data')->popStart();
$rowIndex = -1;
while ($row = $this->dataStore('data')->pop()) {
    $rowIndex++;
    $pc = $row['accuPercentage'];
    if ($pc > 80) break;
}
$index80 = $rowIndex - 1;

Finally you can change Chartjs' column colors in by using an array as background colors like this:

ColumnChart::create(array(
    "dataSource" => $this->dataStore('data'),
    "columns" => ["name", "accuPercentage"],
    "onReady" => "function() {
        var numberOfRows = {$numberOfRows};
        var index80 = {$index80};
        var chartjsObj = MyChart.chart.chart;
        chartjsObj.data.datasets[0].backgroundColor = ['red', 'red', 'red', 'blue', 'blue', 'blue']; // create an array of colors with with total {numberOfRows} elements and the first {index80} elements are red, here numberOfRows = 6 and index80 = 4
        chartjsObj.update(); // redraw the chart
    }",
Adolfo Alonso commented on Oct 24, 2023

Hi Sebastián, 
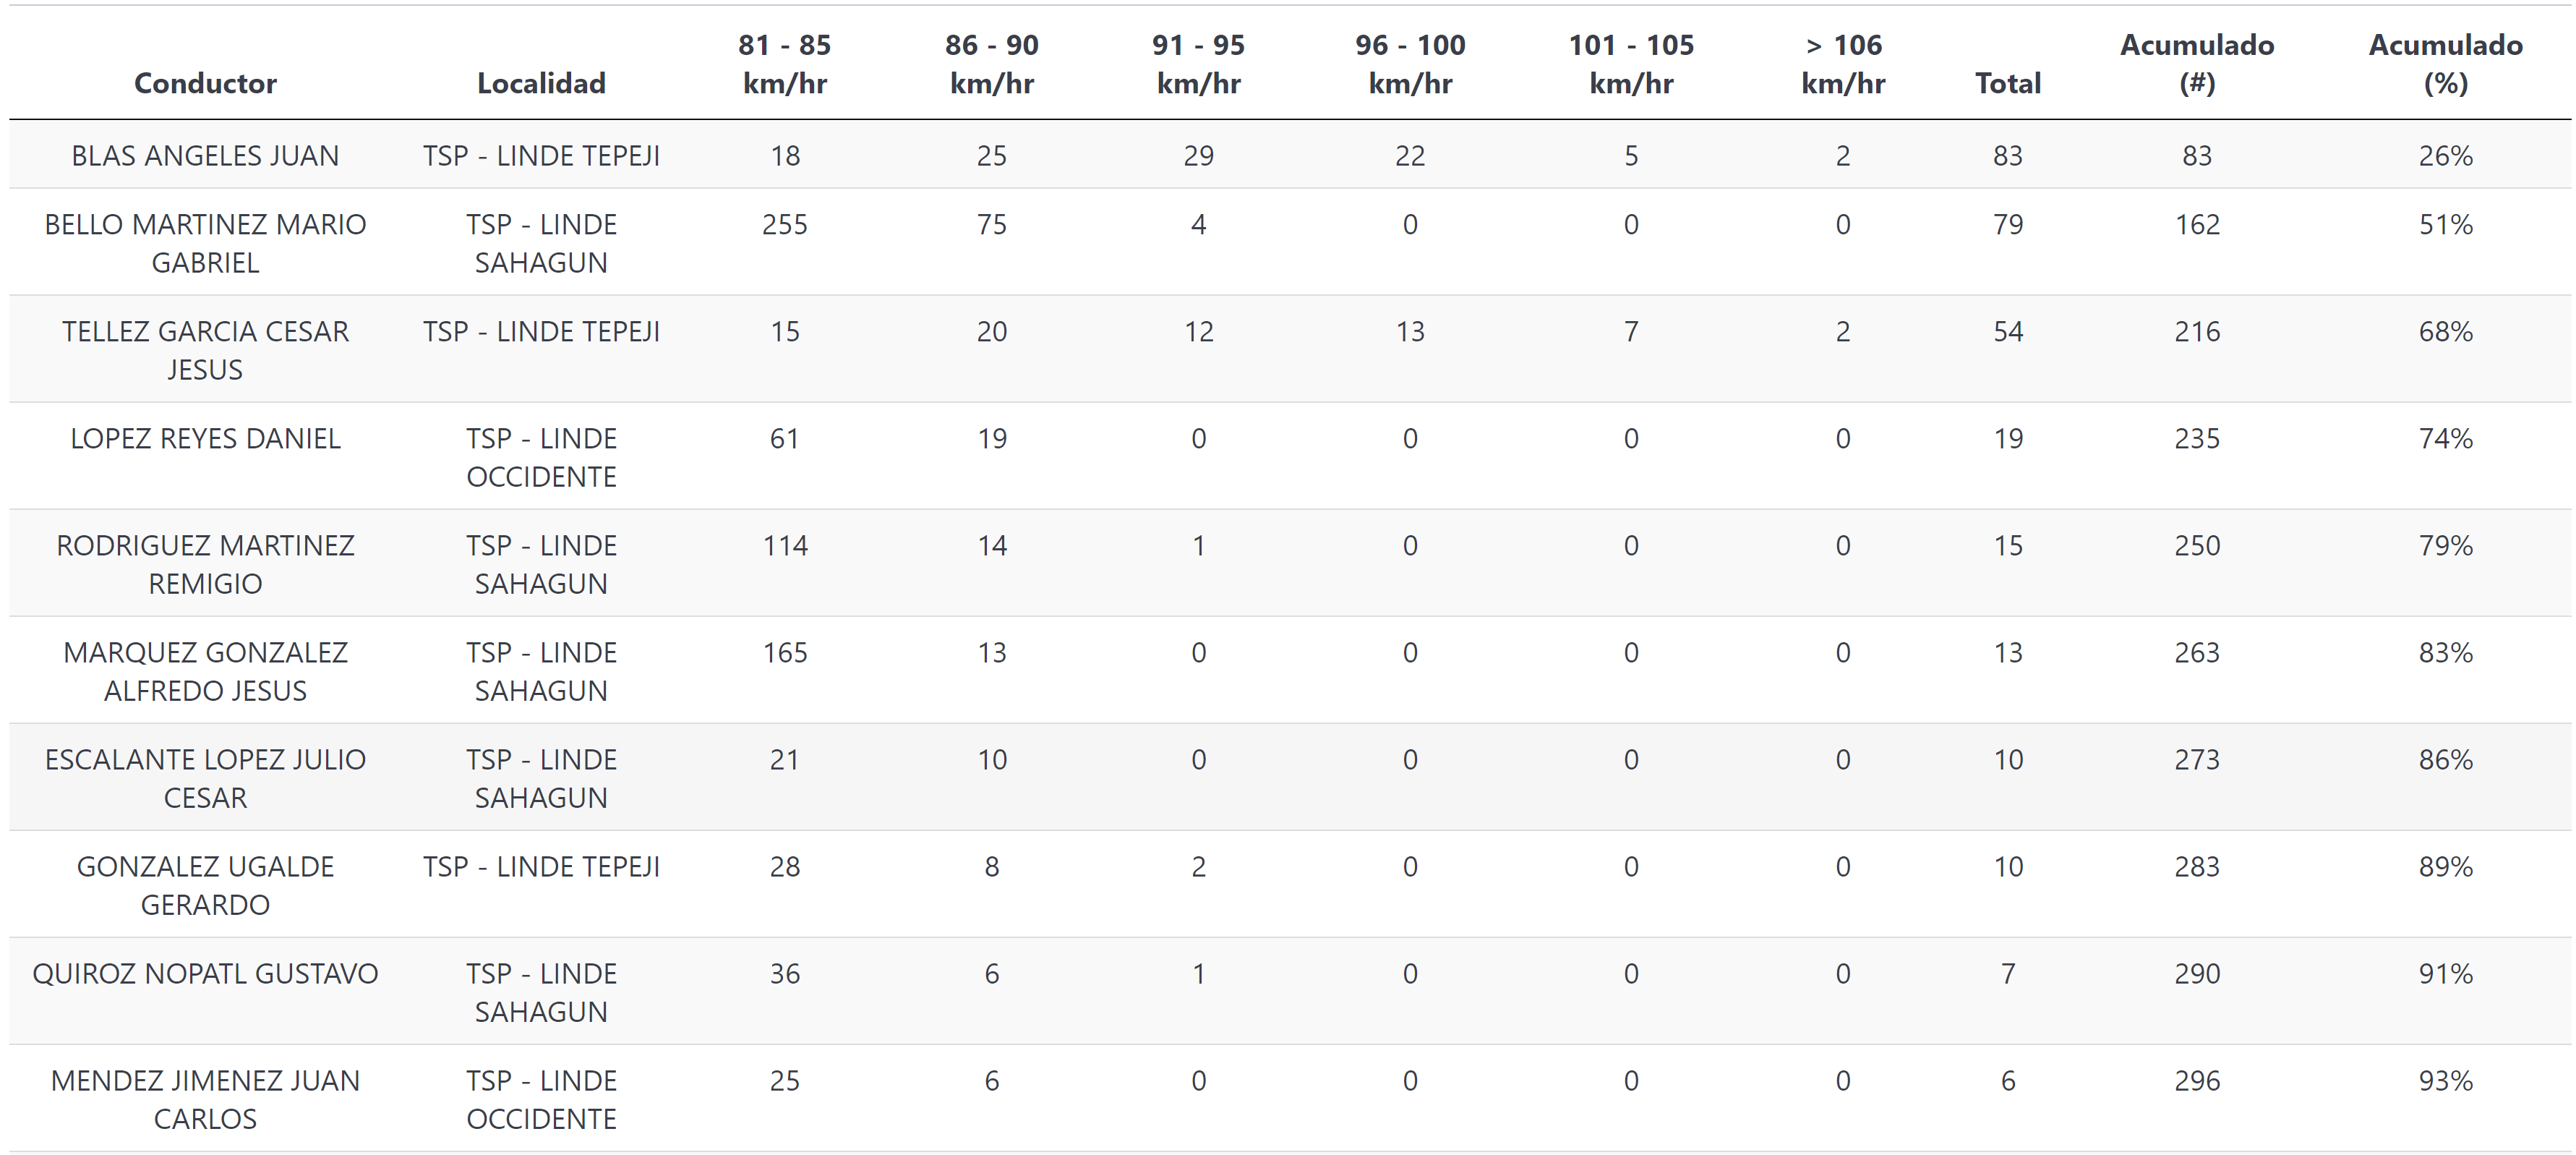
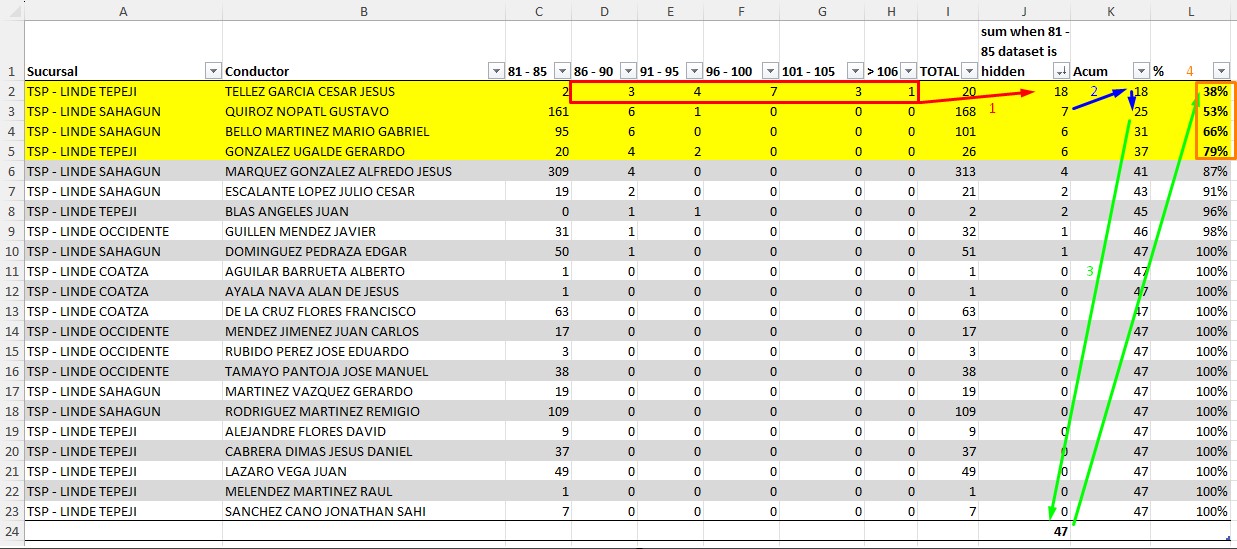
I got it working all the way to identifying which row goes ever 80% on the running total, thanks for that. 
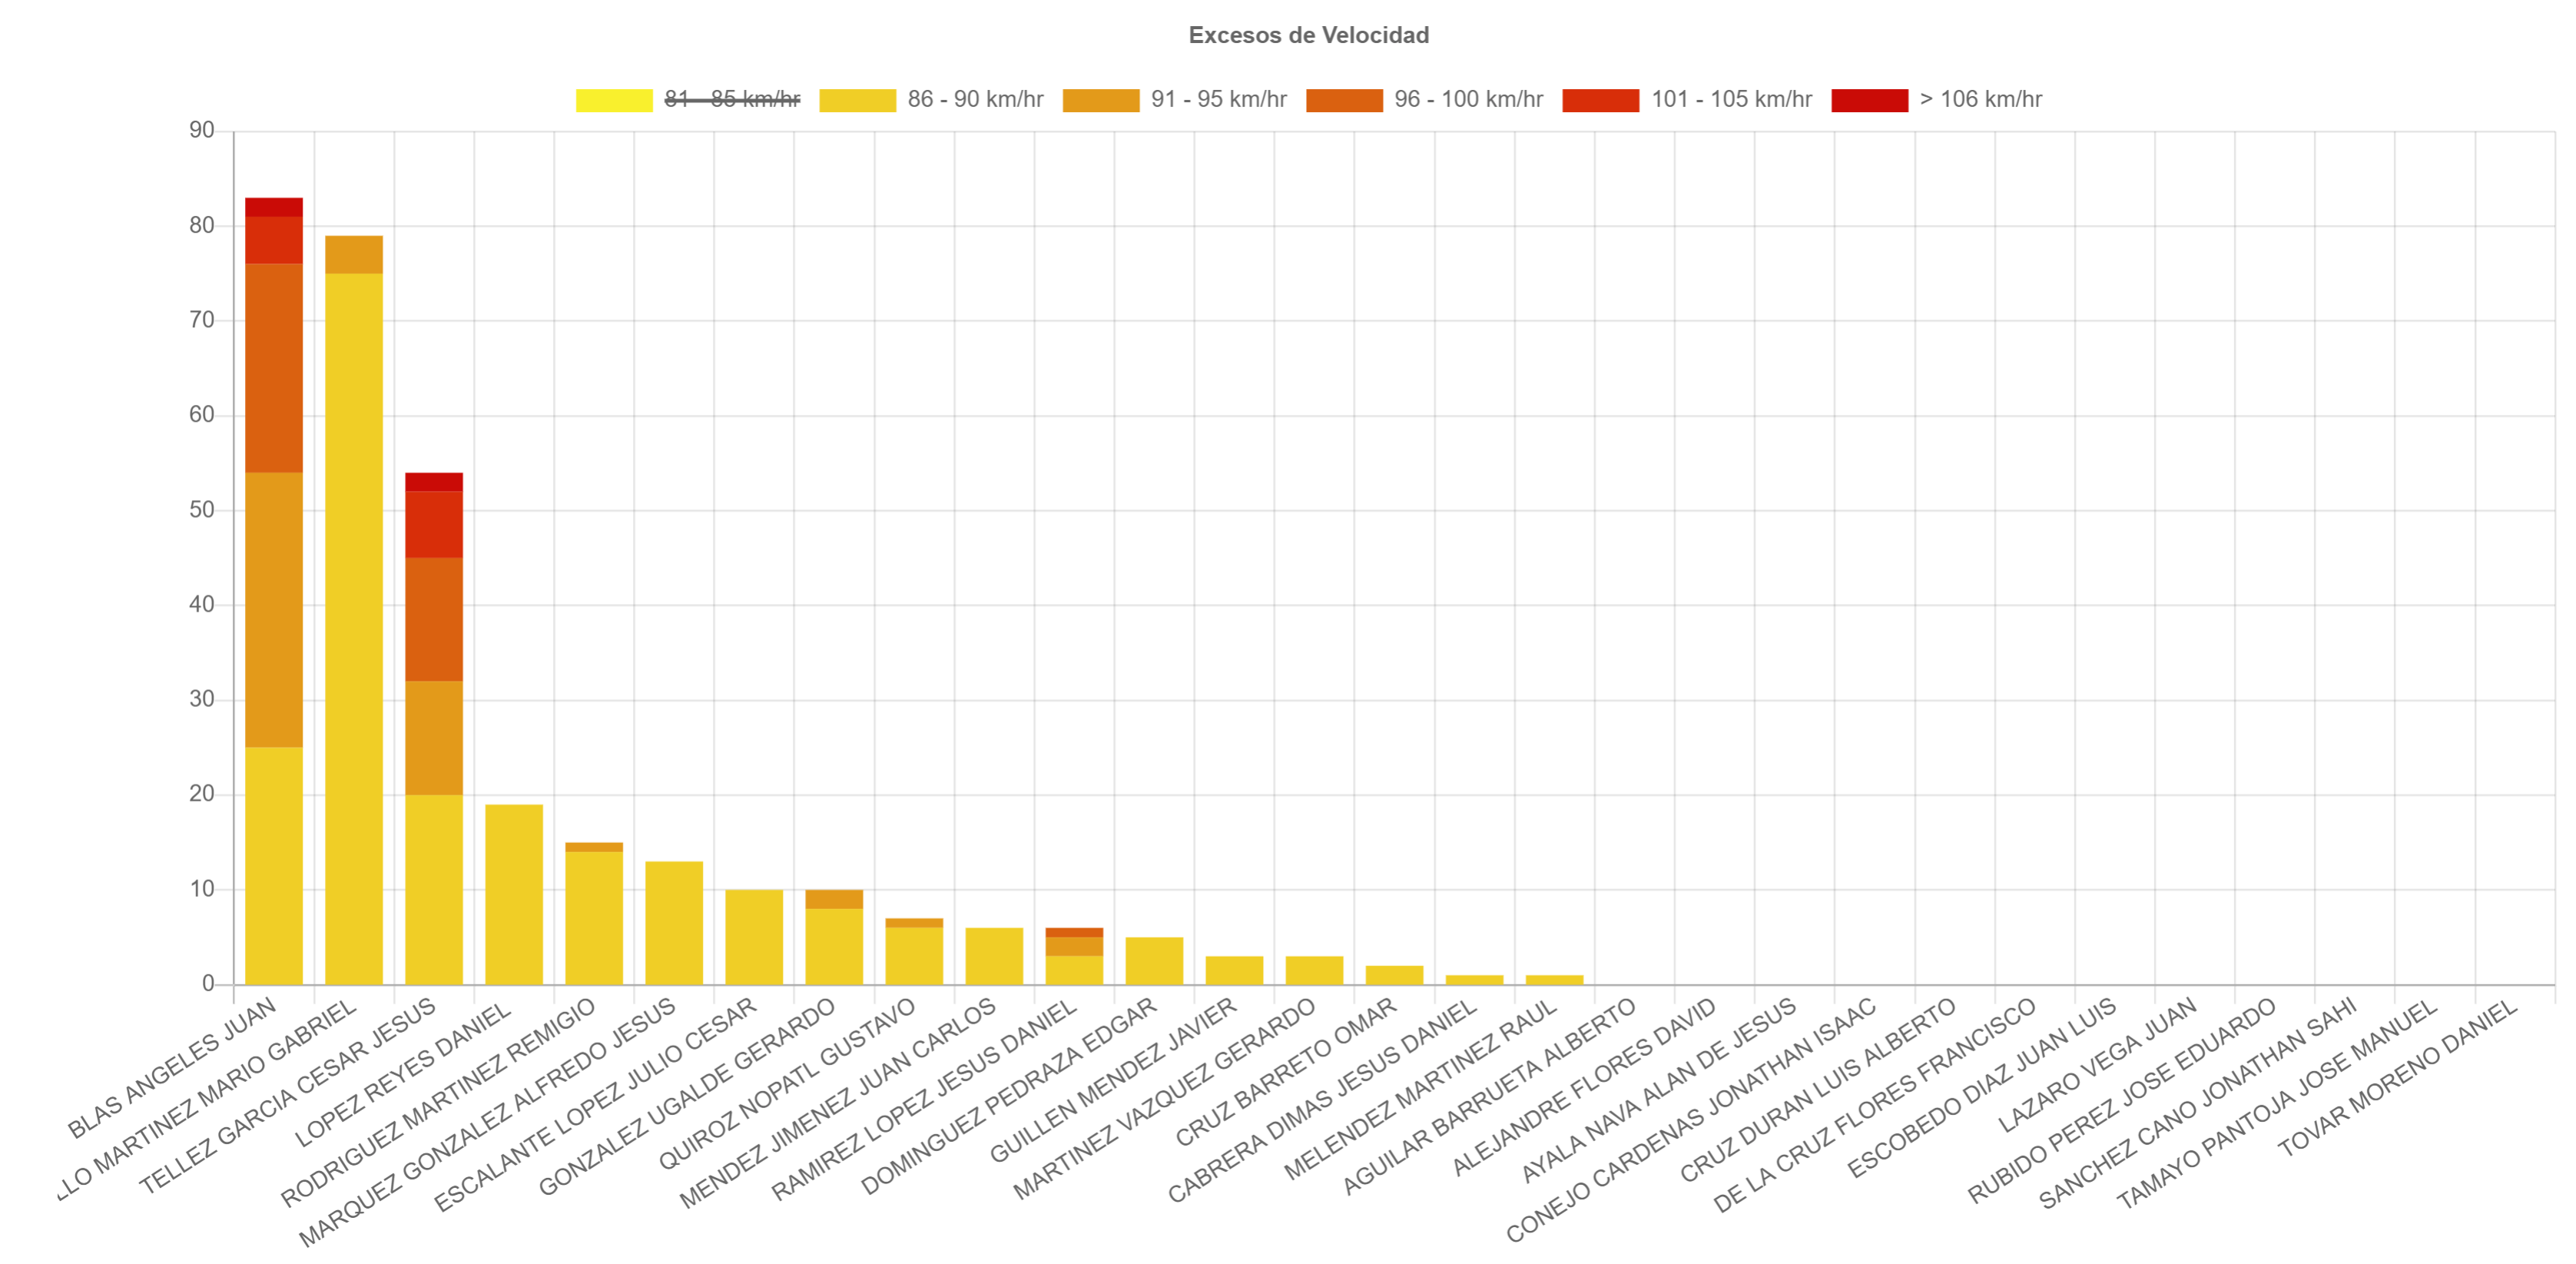
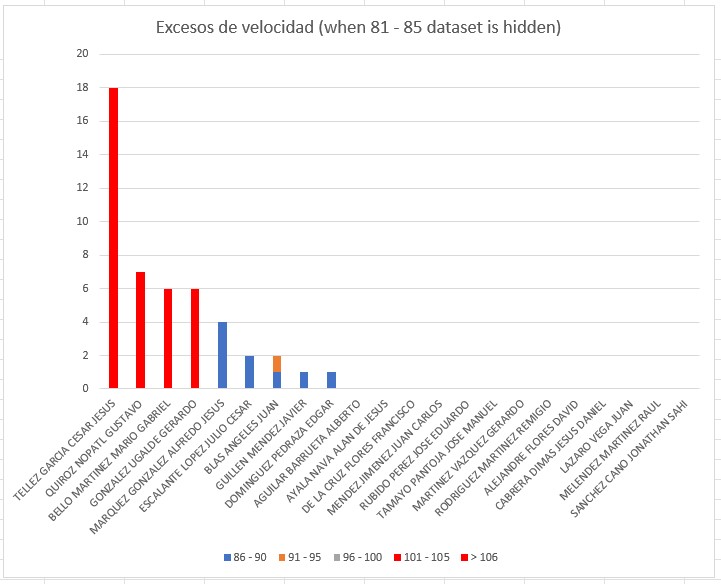
Now I’m stuck in the ColumnChart formatting... Why would I need to manually create an array of colors? anyways I would rather change the column border size on of the drivers that make up this 80% instead, can you help me?

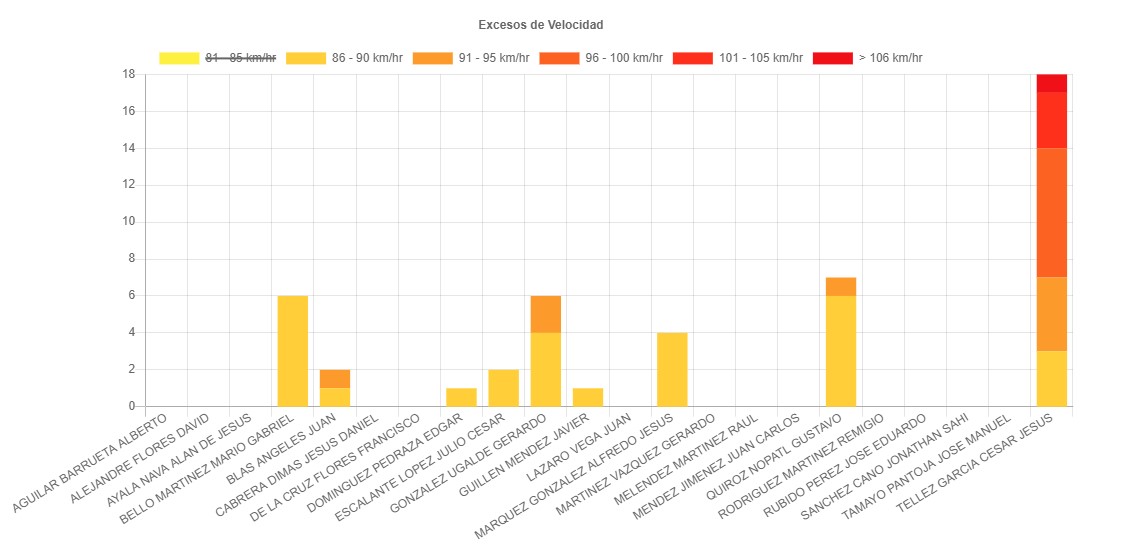
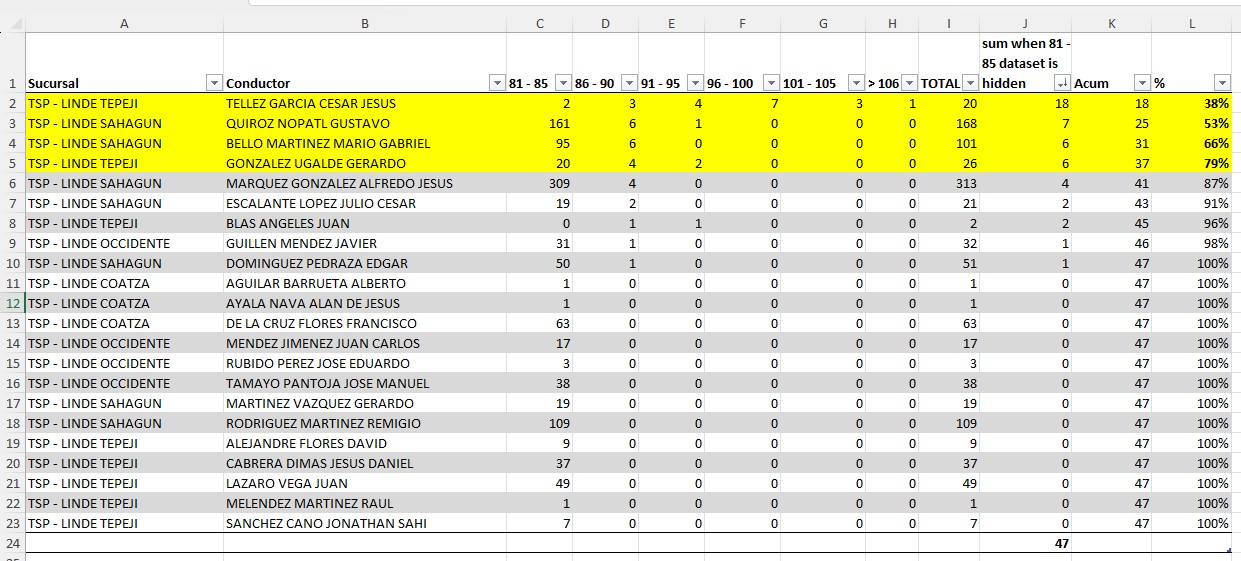
The other function that I’m looking to achieve is that the AccumulativeColumn, AggregatedColumn and CalculatedColumn only take into consideration the visible datasets of the ChartJs. so that when the user shows or hides a dataset the chart and the table both recalculate and redraw.

This is my code so far: MyReport.php

<?php
	// Require autoload.php from koolreport library
	require_once "../../koolreport/core/autoload.php";

	use \koolreport\processes\CalculatedColumn;
	use \koolreport\processes\Sort;
	use \koolreport\processes\AggregatedColumn;
	use \koolreport\processes\AccumulativeColumn;
	
	//Step 2: Creating Report class
	class MyReport extends \koolreport\KoolReport
	{
		use \koolreport\amazing\Theme;
		use \koolreport\inputs\Bindable;
		use \koolreport\inputs\POSTBinding;
		
		
		protected function defaultParamValues()
		{
			return array(
				"dateRange"=>array(
					date("Y-m-d", strtotime('-7 days')) . " 00:00:00",
					date("Y-m-d", strtotime('-0 days')) . " 23:59:59"
				),
				"customers"=>array(),
			);
		}
		
		protected function bindParamsToInputs()
		{
			return array(
            "dateRange"=>"dateRange",
            "customers"=>"customers",
			);
		}
		
		public function settings()
		{
			return array(
            "dataSources"=>array(....)
			);
		}
		public function setup()
		{
			$this->src('automaker')
			->query("SELECT
					e.conductor AS conductor, 
					(SELECT descripzam FROM cat_sucursales WHERE sucursalid = e.sucdriverid) AS sucursal,
					SUM(CASE
					  WHEN speedgeo BETWEEN 80 AND 85 THEN 1 ELSE 0 END
					) AS '81 - 85',
					SUM(CASE
					  WHEN speedgeo BETWEEN 86 and 90 THEN 1 ELSE 0 END
					) AS '86 - 90',
					SUM(CASE
					  WHEN speedgeo BETWEEN 91 and 95 THEN 1 ELSE 0 END
					) AS '91 - 95',
					SUM(CASE
					  WHEN speedgeo BETWEEN 96 and 100 THEN 1 ELSE 0 END
					) AS '96 - 100',
					SUM(CASE
					  WHEN speedgeo BETWEEN 101 and 105 THEN 1 ELSE 0 END
					) AS '101 - 105',
					SUM(CASE
					  WHEN speedgeo > 106 THEN 1 ELSE 0 END
					) AS '> 106'
					##,COUNT(speedgeo) AS totalw
					FROM tbl_geo_eventos_hist e
					INNER JOIN tbl_conductor c on c.idgeo = e.driver
					INNER JOIN cat_sucursales s ON s.sucursalid = c.sucursalid
					WHERE e.activefrommx > :start
					AND	e.activefrommx < :end
					AND e.sucdriverid IN (18, 19, 23, 24)	##Exceso sucedio mientras en LINDE (18, 19, 23, 24)
					AND e.rule = 'aQbmuxZY4Nk-2j6CYh85sQQ' 	##Exceso de Velocidad
					AND c.estatus = 1 						##Este activo
					AND c.sucursalid IN (18, 19, 23, 24)	##Actualmente en LINDE
					AND c.conductorid NOT IN (0, 22)		##Quitar Fidel y Externo
					GROUP BY e.conductor, e.sucdriverid")
			->params(array(
			":start"=>$this->params["dateRange"][0],
			":end"=>$this->params["dateRange"][1],
            ":customers"=>$this->params["customers"]
			))
			->saveTo($source);
			
			$source->pipe($this->dataStore("purchase_summary"));
			
			$source->pipe(new CalculatedColumn(array(
				"total"=>"/*{81 - 85}+*/{86 - 90}+{91 - 95}+{96 - 100}+{101 - 105}+{> 106}" //THIS IS WHERE IM MANUALLY NOT ADDING UP THE 81 - 85 DATASET, THIS NEEDS TO BE DYNAMIC
			)))
			->pipe(new Sort(array(
				"total"=>"desc"
			)))
			->pipe(new AccumulativeColumn(array(
				"acumulado"=>"total"
			)))
			->pipe(new AggregatedColumn(array(
				"excepciones_totales"=>array("sum","total")
			)))	
			->pipe(new CalculatedColumn(array(
				"acumulado%"=>"{acumulado}*100/{excepciones_totales}"
			)))
			->pipe($this->dataStore("result"));
		}    
	}	

MyReport.view.php

<?php 
    use \koolreport\inputs\DateRangePicker;
    use \koolreport\inputs\MultiSelect;
    use \koolreport\chartjs\ColumnChart;
	use \koolreport\datagrid\DataTables;
	
	$numberOfRows = $this->dataStore('result')->count();
	$this->dataStore('result')->popStart();
	$rowIndex = -1;
	while ($row = $this->dataStore('result')->pop()) {
		$rowIndex++;
		$pc = $row['acumulado%'];
		if ($pc > 80) break;
	}
	$index80 = $rowIndex - 1;
	echo $index80 . " - ". $numberOfRows;
    
?>
<head>
	<title>Excesos de Velocidad</title>
</head>
<div class="container-fluid app-container">
	<div style="margin-bottom:50px;"></div>	
	<div class="card card-accent-primary">
		<div class="card-body smart-title">
			<div class="doc-content"><h1>Reporte de Velocidad</h1>
				<p>Reporte que muestra los excesos de velocidad de un rango de tiempo</p>
				<hr>
				<form method="post">
					<div class="row">
						<div class="col-md-8 offset-md-2">
							<div class="form-group">
								<?php
									DateRangePicker::create(array(
									"name"=>"dateRange"
									))
								?>
							</div>
							<div class="form-group text-center">
								<button class="btn btn-success"><i class="glyphicon glyphicon-refresh"></i>Cargar</button>
							</div>
							</div>
					</div>
					<pre><code><?php //echo json_encode($this->params,JSON_PRETTY_PRINT) ?></code></pre>
				</form>
				<hr>
				<center>
				<div style="max-width: 90%;">
					<?php
						
						
						ColumnChart::create(array(
						"name" => "MyChart", // set a unique chart name to access its javascript object
						"title"=>"Excesos de Velocidad",
						"dataSource"=>$this->dataStore('result'),
						"columns"=>array(
							"conductor",
							"81 - 85"=>array(
								"label"=>"81 - 85 km/hr",
								"type"=>"number",
								"backgroundColor"=>"#FEF001",
								"borderWidth"=>0,
								"display"=>false),
							"86 - 90"=>array(
								"label"=>"86 - 90 km/hr",
								"type"=>"number",
								"backgroundColor"=>"#FFCE03",
								"borderWidth"=>0),
							"91 - 95"=>array(
								"label"=>"91 - 95 km/hr",
								"type"=>"number",
								"backgroundColor"=>"#FD9A01",
								"borderWidth"=>0),
							"96 - 100"=>array(
								"label"=>"96 - 100 km/hr", ##"label"=>"> 96 km/hr",
								"type"=>"number",
								"backgroundColor"=>"#FD6104",
								"borderWidth"=>0),
							"101 - 105"=>array(
								"label"=>"101 - 105 km/hr",
								"type"=>"number",
								"backgroundColor"=>"#FF2C05",
								"borderWidth"=>0),
							"> 106"=>array(
								"label"=>"> 106 km/hr",
								"type"=>"number",
								"backgroundColor"=>"#F00505",
								"borderWidth"=>0),
						),
						"onReady" => "function() {
							var numberOfRows = {$numberOfRows};
							var index80 = {$index80};
							var chartjsObj = MyChart.chart.chart;
							chartjsObj.data.datasets[0].backgroundColor = ['red', 'red', 'red', 'blue', 'blue', 'blue']; // create an array of colors with with total {numberOfRows} elements and the first {index80} elements are red, here numberOfRows = 6 and index80 = 4
							chartjsObj.update(); // redraw the chart
						}",
						"stacked"=>true,
						"options" => array(
							"scales" => array(
								"yAxes" => array(
									array(
										"ticks" => array(
											"callback" => "function(value, index, values) {return value.toFixed(0);}",
											//"stepSize" => 1
										),
									),
								),
							)
						),
						"onReady" => "function() {
							var chartjsObj = MyChart.chart;
							chartjsObj.getDatasetMeta(0).hidden = true;
							chartjsObj.chart.update();
						}"
						));
					?>
				</div>
				</center>
				<hr>
				<div style="max-width: 100%; overflow-x: scroll;">
					<?php 
						DataTables::create(array(
								"dataSource"=>$this->dataStore("result"),
								"plugins"=>array("Buttons", "FixedColumns", "FixedHeader", "KeyTable", "Responsive", "RowReorder", "Scroller", "SearchPanes"),
							    "options"=>array(
									//"searching"=>true,
									"dom" => "Bfrtip",
						            "buttons" => array("copy", "excel"), //"csv", "pdf", "print", "colvis",
									'ordering' => false
									//"order"=>array(
									//	array(8,"desc")
									//)
								),
								"cssClass"=> array(
									"td" => "text-center",
									"th" => "text-center",
								),
								"columns"=>array(
									"conductor"=>array(
										"label"=>"Conductor"),
									"sucursal"=>array(
										"label"=>"Localidad"),
									"81 - 85"=>array(
										"label"=>"81 - 85 km/hr",
										"type"=>"number"),
									"86 - 90"=>array(
										"label"=>"86 - 90 km/hr",
										"type"=>"number"),
									"91 - 95"=>array(
										"label"=>"91 - 95 km/hr",
										"type"=>"number",
										"backgroundColor"=>"#FD9A01",
										"borderWidth"=>0),
									"96 - 100"=>array(
										"label"=>"96 - 100 km/hr", ##"label"=>"> 96 km/hr",
										"type"=>"number",
										"backgroundColor"=>"#FD6104",
										"borderWidth"=>0),
									"101 - 105"=>array(
										"label"=>"101 - 105 km/hr",
										"type"=>"number",
										"backgroundColor"=>"#FF2C05",
										"borderWidth"=>0),
									"> 106"=>array(
										"label"=>"> 106 km/hr",
										"type"=>"number",
										"backgroundColor"=>"#F00505",
										"borderWidth"=>0),
									"total"=>array(
										"label"=>"Total",
										"type"=>"number"),
									"acumulado"=>array(
										"label"=>"Acumulado (#)",
										"type" => "number",
										"decimals" => 0),
									"acumulado%"=>array(
										"label"=>"Acumulado (%)",
										"type" => "number",
										"decimals" => 0,
										"suffix"   => "%")
								),
								
							)
						);
					?>
				</div>
			</div>
			<hr>
		</div>
	</div>
</div>					

And this is the result so far:

Sebastian Morales commented on Oct 24, 2023

You can catch the legend click event of chartjs with options' legend's onClick:

ColumnChart::create(array(
            ...
            "options" => [
                "legend" => [
                    "onClick" => "function(event, legendItem) {
                        console.log('legend onClick', event, legendItem);
                        var index = legendItem.datasetIndex; // this is the column/series index clicked
                        var ci = this.chart;
                        var meta = ci.getDatasetMeta(index);
                        meta.hidden = meta.hidden === null ? !ci.data.datasets[index].hidden : null; // change the series hidden property
                        ci.update(); // redraw the chart
                        submitForm(index);
                    }"
                ]
            ], 
));

Then in function submitForm() you can submit your form with a hidden input value = index or send an ajax request to update the chart.

Finally, in your report's setup, catch the index if it exists and change your processes accordingly.

As for the column border size, you can use my answer on column color, just replace backgroundColor with borderWidth:

        ...
        chartjsObj.data.datasets[0].borderWidth = [...];
        chartjsObj.data.datasets[1].borderWidth = [...];
        chartjsObj.data.datasets[2].borderWidth = [...];
        chartjsObj.update();

Build Your Excellent Data Report

Let KoolReport help you to make great reports. It's free & open-source released under MIT license.

Download KoolReport View demo
help needed

None