KoolReport's Forum
Official Support Area, Q&As, Discussions, Suggestions and Bug reports.
Forum's Guidelines
Line chart as being disabled on initial load #3172
Sure, its actually column chart, I would like to hide "81 - 85 km/hr" on load.
<div class="example">
	<?php
		ColumnChart::create(array(
		"title"=>"Excesos de Velocidad",
		"dataSource"=>$this->dataStore('purchase_summary'),
		"columns"=>array(
			"conductor",
			"81 - 85"=>array(
				"label"=>"81 - 85 km/hr",
				"type"=>"number",
				"backgroundColor"=>"#FFE733",
				"borderWidth"=>0,
				"display"=>false),
			"86 - 90"=>array(
				"label"=>"86 - 90 km/hr",
				"type"=>"number",
				"backgroundColor"=>"#FFAA1C",
				"borderWidth"=>0),
			"91 - 95"=>array(
				"label"=>"91 - 95 km/hr",
				"type"=>"number",
				"backgroundColor"=>"#FF8C01",
				"borderWidth"=>0),
			"96 - 100"=>array(
				"label"=>"> 96 km/hr", ##"label"=>"96 - 100 km/hr",
				"type"=>"number",
				"backgroundColor"=>"#ED2938",
				"borderWidth"=>0),
			/*"101 - 105"=>array(
				"label"=>"101 - 105 km/hr",
				"type"=>"number"),
			"> 106"=>array(
				"label"=>"> 106 km/hr",
				"type"=>"number"),*/
		),
		"stacked"=>true,
		"options" => array(
			"scales" => array(
				"yAxes" => array(
				array( // add a layer of array here
					"ticks" => array(
						"callback" => "function(value, index, values) {return value.toFixed(0);}"
					),
				),
				),
			)
		)
		));
	?>
</div>
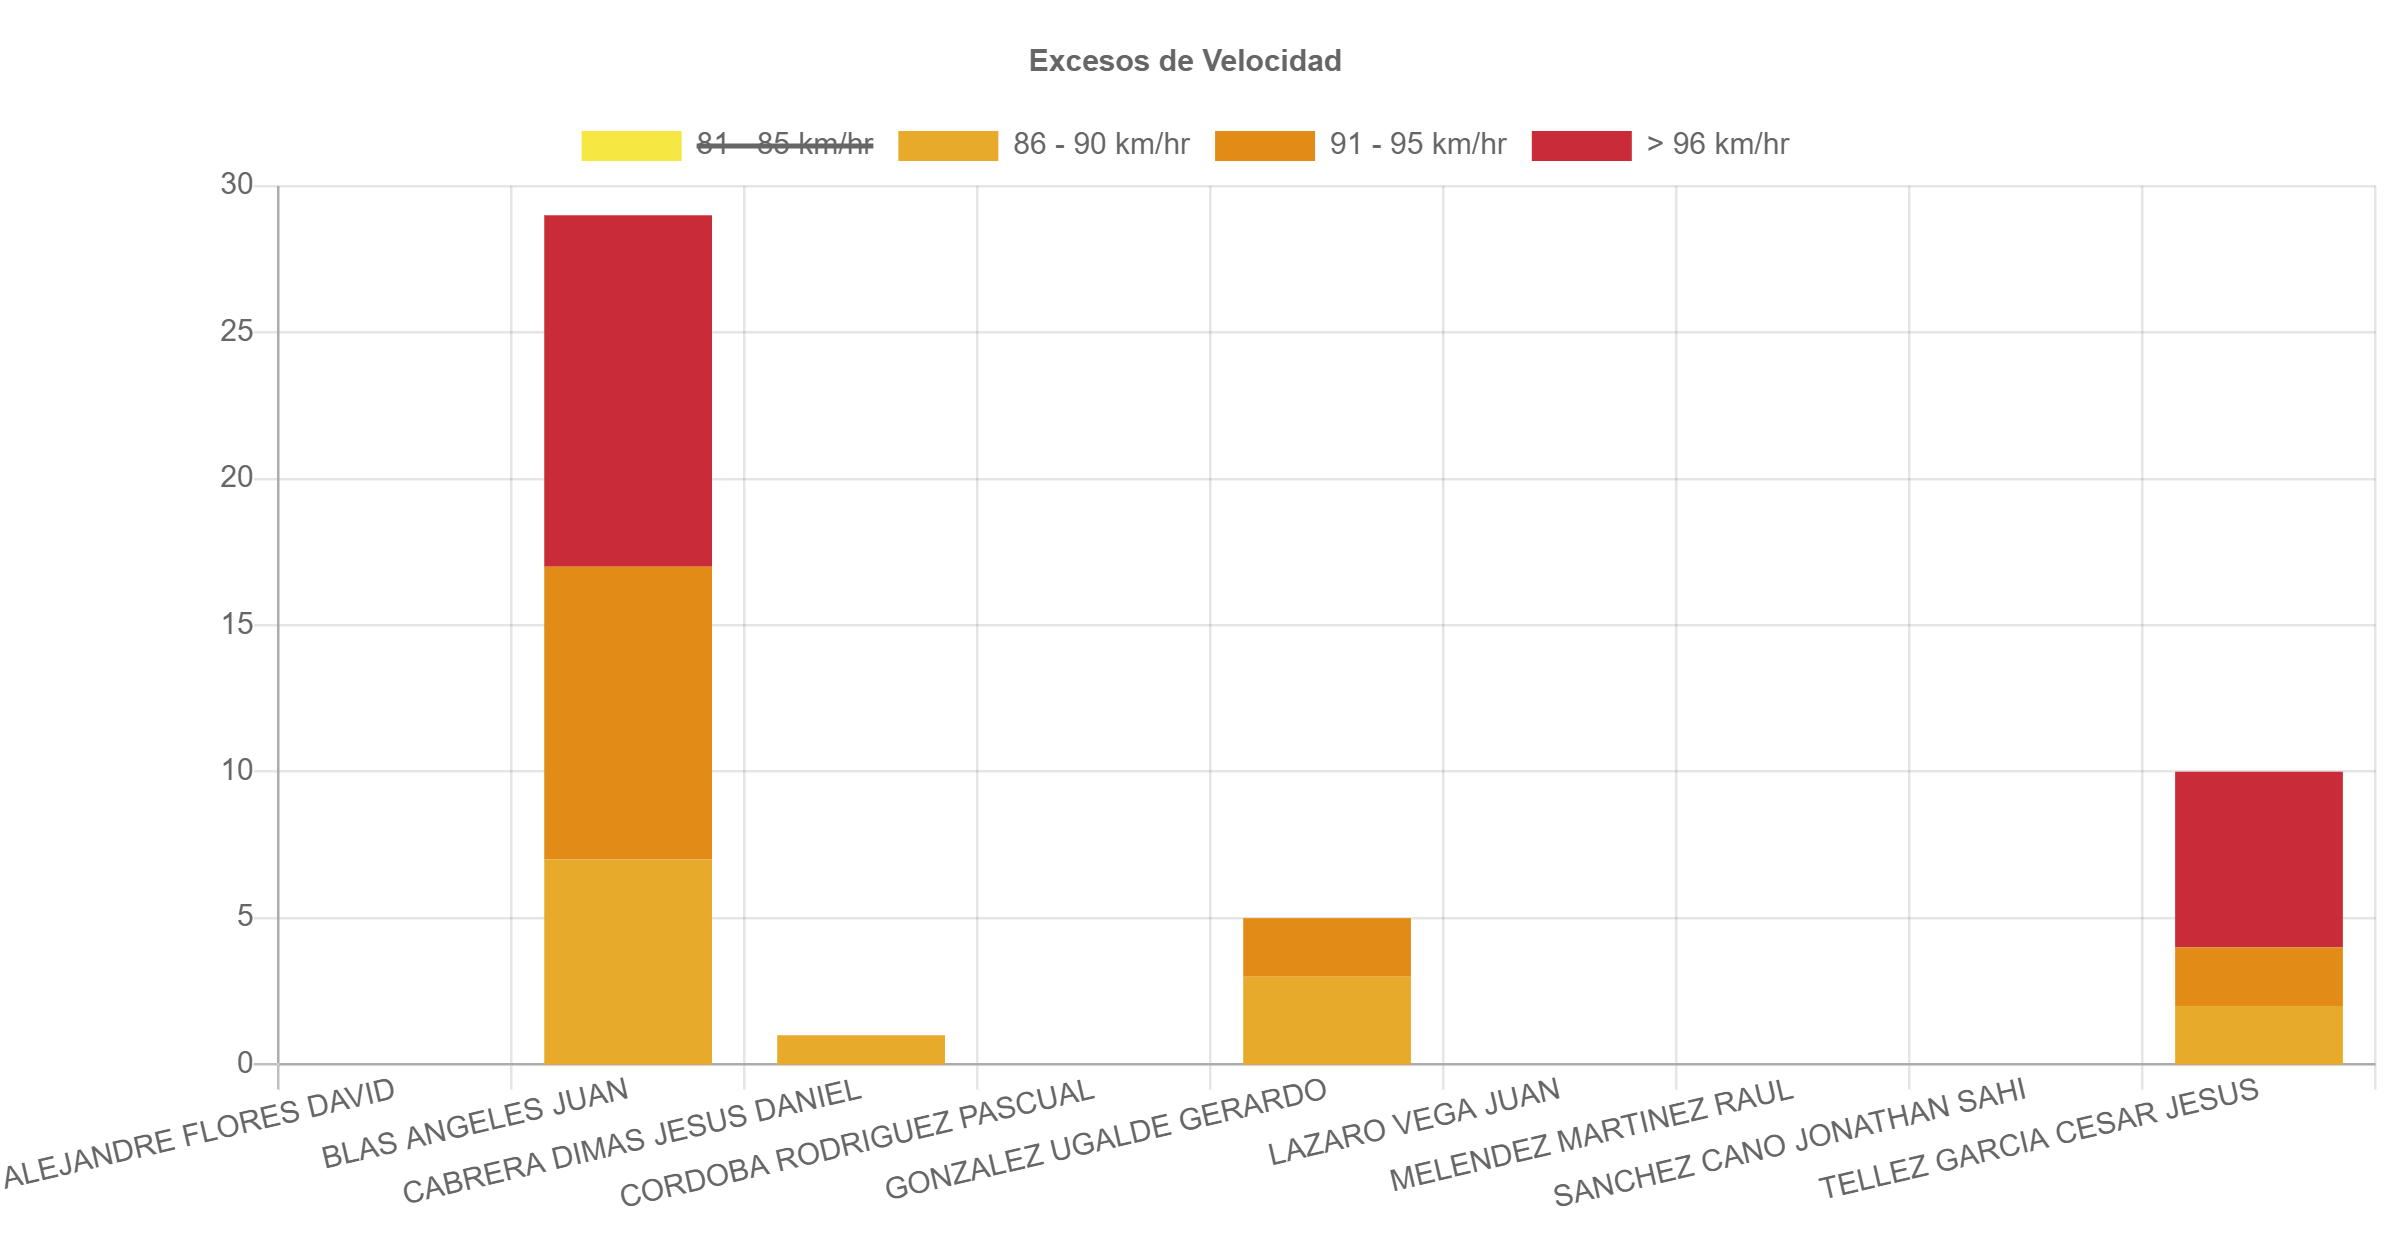
You can try to hide a series on load with the following javascript function in a chart's "onReady":
    ColumnChart::create(array(
        "name" => "MyChart", // set a unique chart name to access its javascript object
        ...
        "onReady" => "function() {
            var chartjsObj = MyChart.chart;
            chartjsObj.getDatasetMeta(0).hidden = true; // set the first series to be hidden
            chartjsObj.chart.update(); // redraw the chart
        }"
    ));
Build Your Excellent Data Report
Let KoolReport help you to make great reports. It's free & open-source released under MIT license.
Download KoolReport View demo