KoolReport's Forum

Official Support Area, Q&As, Discussions, Suggestions and Bug reports.
Forum's Guidelines

Full numbers on ChartJS columns #3160

Open Adolfo Alonso opened this topic on on Sep 29, 2023 - 11 comments

Adolfo Alonso commented on Sep 29, 2023

Hello, Im using ChartJS column chart and need to only display full numbers (no decimals) on Y axis, has anyone achieved this? Thanks

Sebastian Morales commented on Oct 3, 2023

You can format the Y axis numbers of Chartjs with the following options:

LineChart::create(array(
    ...
    "options" => [
        'scales' => [
            'yAxes' => [
                [
                    'ticks' => [
                        'callback' => "function(value, index, values) {
                            return value.toFixed(2);
                        }"
                    ]
                ]
            ]
        ]
    ]
));
Adolfo Alonso commented on Oct 16, 2023

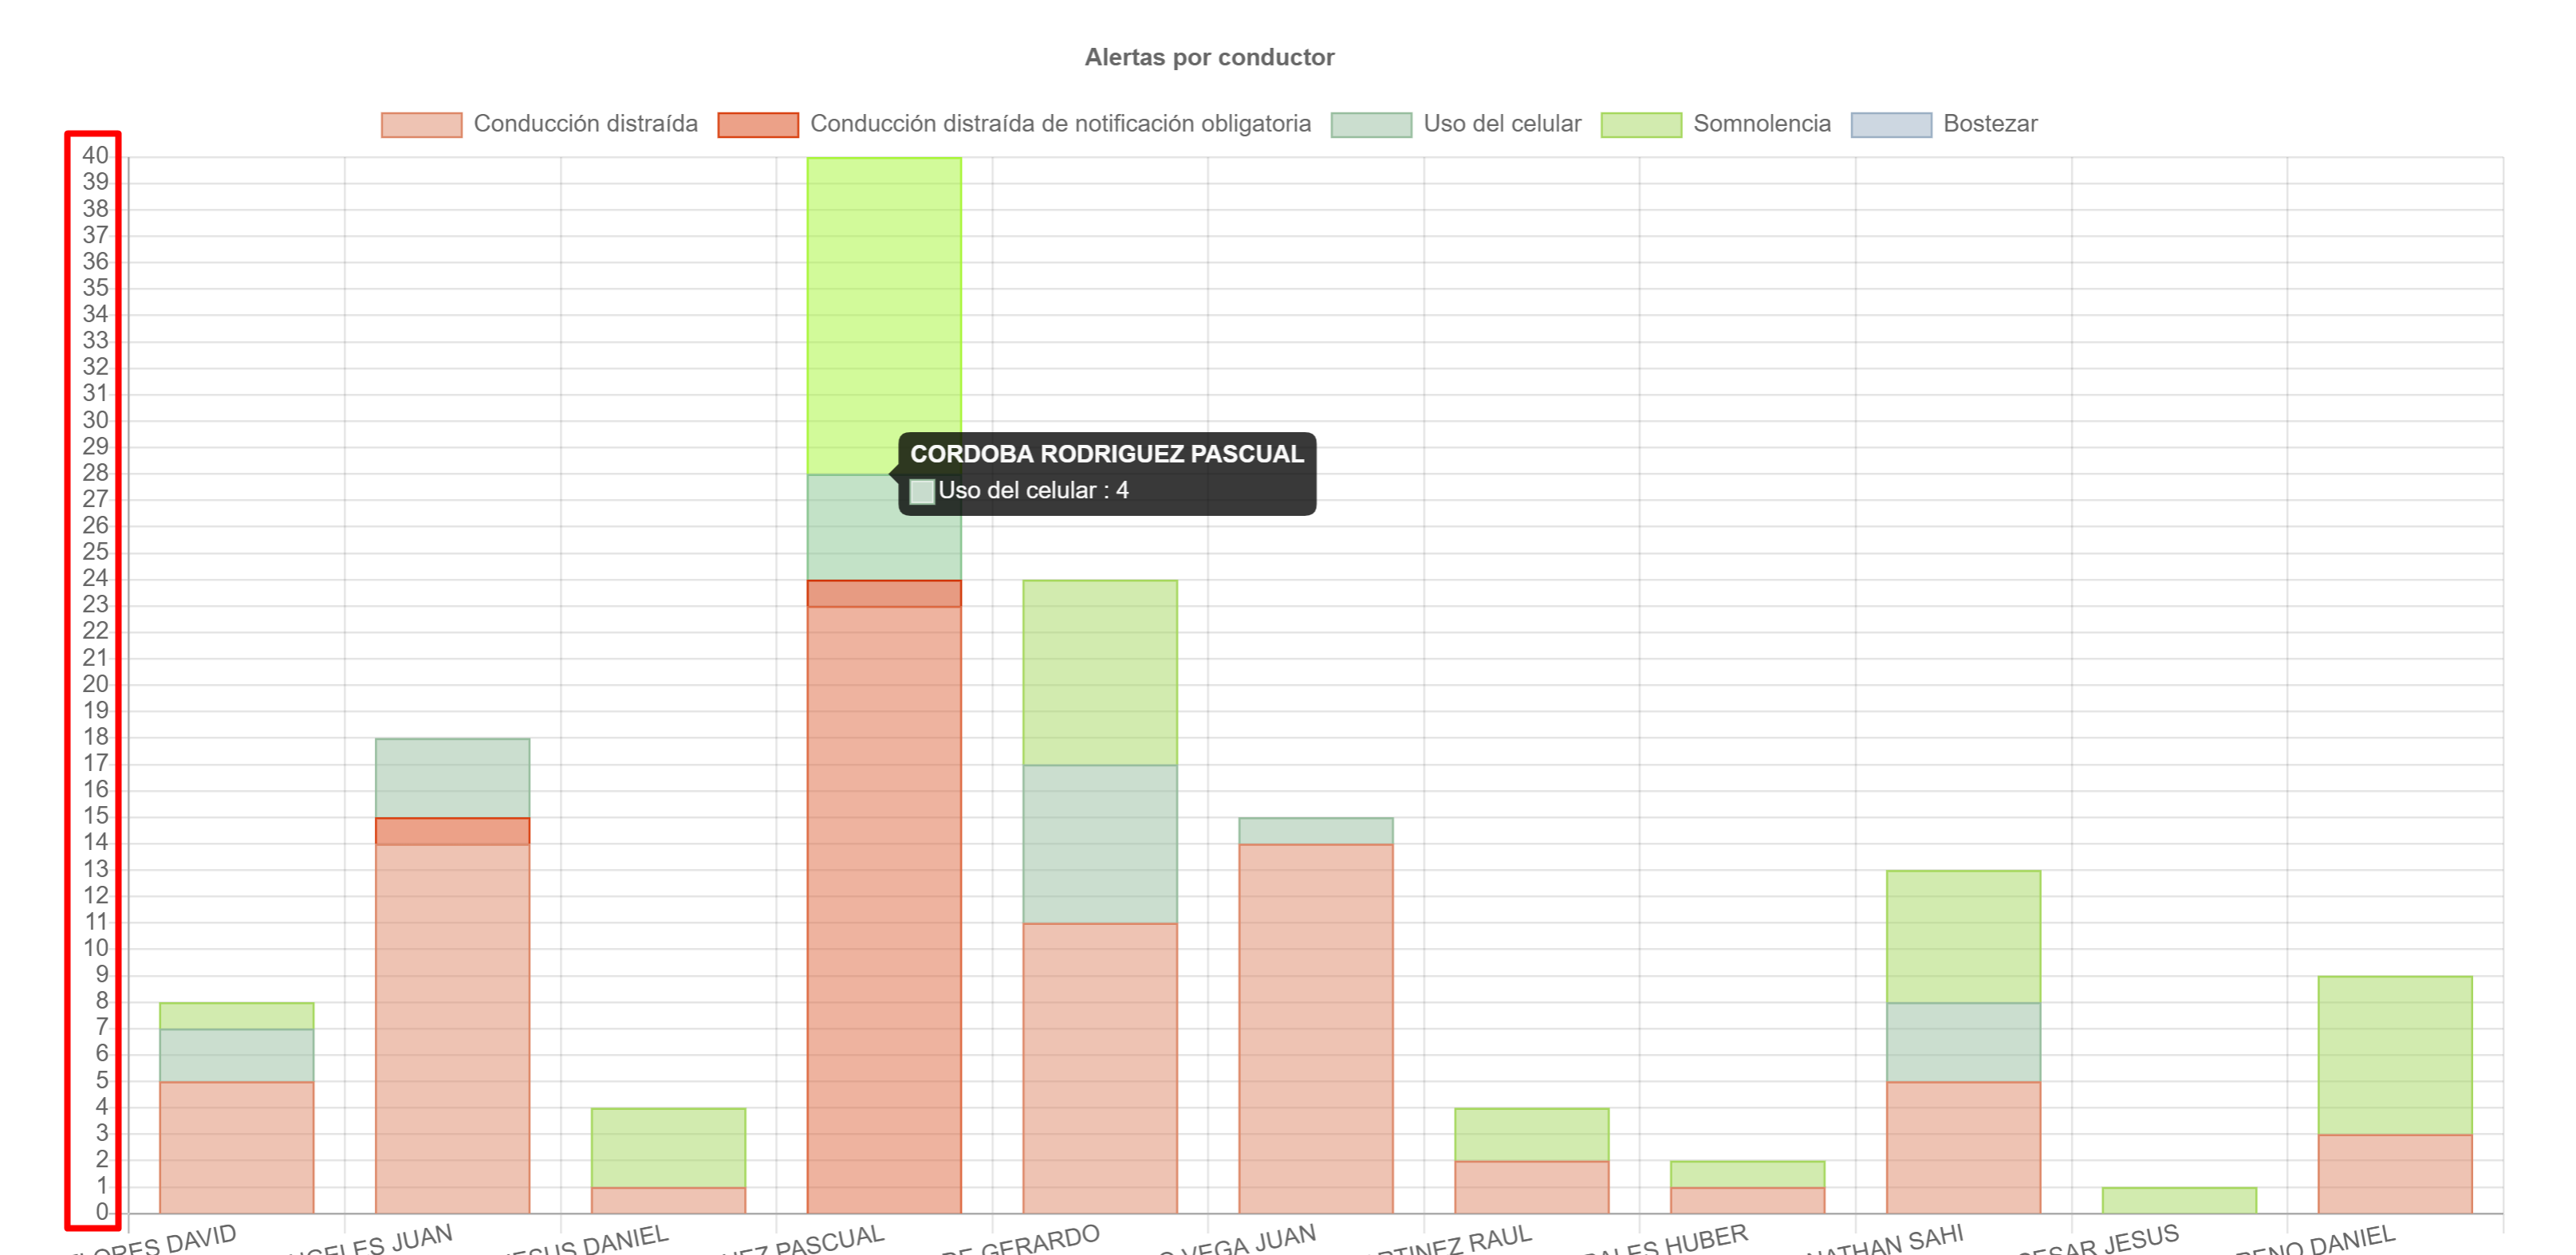
Hello, can you help me, what is wrong?

<?php
	ColumnChart::create(array(
	"title"=>"Alertas por conductor",
	"dataSource"=>$this->dataStore('purchase_summary'),
	"columns"=>array(
		"conductor",
		"conducción distraída"=>array(
			"label"=>"Conducción distraída",
			"type"=>"number"),
		"conducción distraída de notificación obligatoria"=>array(
			"label"=>"Conducción distraída de notificación obligatoria",
			"type"=>"number"),
		"uso del celular"=>array(
			"label"=>"Uso del celular",
			"type"=>"number"),
		"somnolencia"=>array(
			"label"=>"Somnolencia",
			"type"=>"number"),
		"bostezar"=>array(
			"label"=>"Bostezar",
			"type"=>"number"),
	),
	"stacked"=>true,
	"options" => array(
		"scales" => array(
			"yAxes" => array(
				"ticks" => array(
					"callback" => "function(value, index, values) {return value.toFixed(2);}"	
				)
			)
		)
	)
	));
?>
Sebastian Morales commented on Oct 16, 2023

Yes, yAxes is supposed to be an array of arrays (each array for one yAxis). Thus, it should be:

			"yAxes" => array(
                            array( // add a layer of array here
				"ticks" => array(
					"callback" => "function(value, index, values) {return value.toFixed(2);}"	
				),
                            ),
			),
Adolfo Alonso commented on Oct 16, 2023

Hi Sebastian, did like you said and im stil getting decimals.

Maybe I didnt ask the corret question, I want the Y lines to be full numbers only, Thanks!

Sebastian Morales commented on Oct 17, 2023

Pls try this callback js function:

            "callback" => "function(value, index, values) {return value.toFixed(0);}" // use toFixed(0) i.e return no decimals instead of toFixed(2) i.e return 2 decimals
Adolfo Alonso commented on Oct 17, 2023

Hi Sebastian, what I need is to have full numbers on vertical axis, in this example "1 and 2" and not having 1.2, 1.4, etc Something like min vertical axis jump

Sebastian Morales commented on Oct 17, 2023

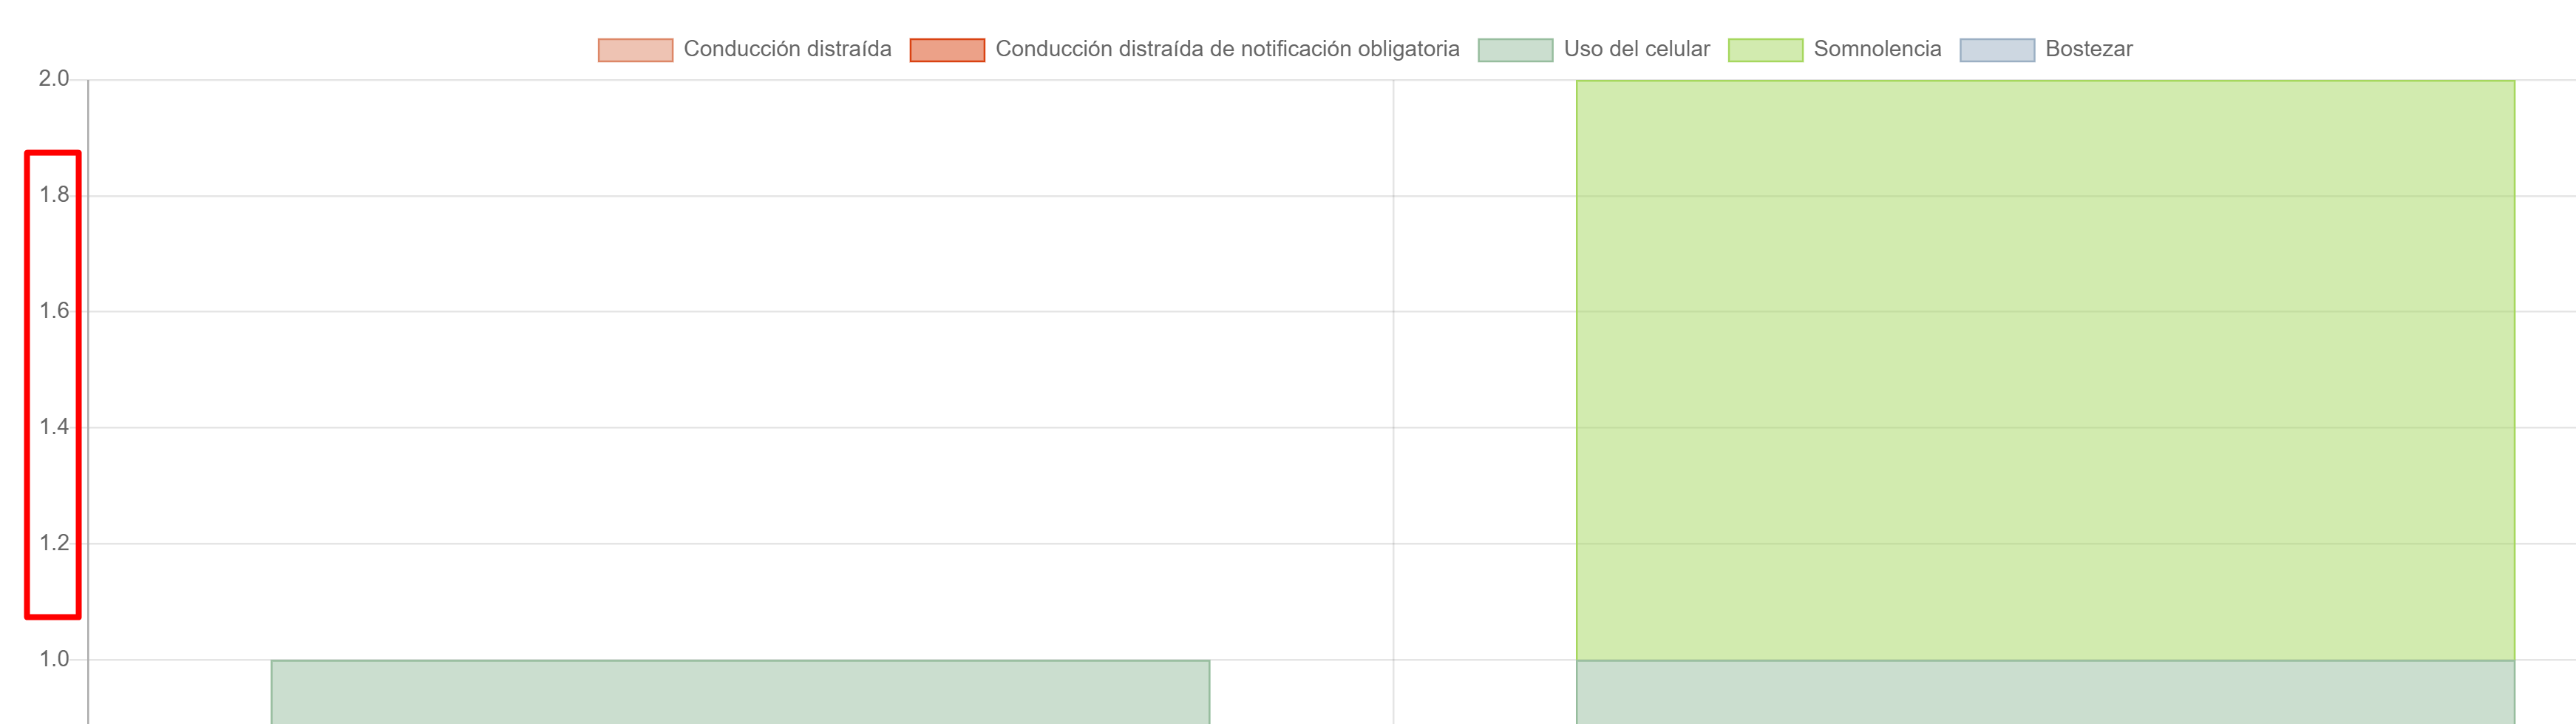
Oh, sorry for misunderstanding your question. What you meant was setting yaxis' step size, not formatting yaxis' step value. That can be achieved that by setting step size in yaxis' ticks like this:

            "options" => [
                'scales' => [
                    'yAxes' => [
                        [
                            'ticks' => [
                                'stepSize' => 1,
                            ]
                        ]
                    ]
                ]
            ], 
Adolfo Alonso commented on Oct 17, 2023

Hi Sebastian, worked... looks good on a small number of values, but when I load more days I have many horizontal lines, can the stepSize be "> 1"?

Sebastian Morales commented on Oct 18, 2023

Certainly, you can set the stepSize to be greater than 1 and fewer than positive infinity.

Adolfo Alonso commented on Oct 18, 2023

Hello, this is what I mean:

"options" => array(
	"scales" => array(
		"yAxes" => array(
		array( // add a layer of array here
			"ticks" => array(
				"callback" => "function(value, index, values) {return value.toFixed(0);}",
				"stepSize" => ">1"
			),
		),
		),
	)
),
Sebastian Morales commented on Oct 19, 2023

I don't think it's possible to use the string ">1" as stepSize. You have to estimate a preferable step size based on your data.

Build Your Excellent Data Report

Let KoolReport help you to make great reports. It's free & open-source released under MIT license.

Download KoolReport View demo
solved

None