KoolReport's Forum
Official Support Area, Q&As, Discussions, Suggestions and Bug reports.
Forum's Guidelines
Metrics range bug #3136
use \koolreport\dashboard\Dashboard; use \koolreport\dashboard\containers\Row; use \koolreport\dashboard\containers\Panel;
class MetricsBoard extends Dashboard {
protected function content()
{
    return [
        Panel::create()->header("Value Metrics")->sub([
            Row::create([
                ValueMetric::create("basicValueMetric")->width(1/3)
                    ->title ("Value Metric")
                    ->type("primary")
                    ->defaultRange("This Month"),

                ValueMetric::create("customRangeForValue")->width(1/3)
                    ->type("warning")
                    ->title("Custom Range")
                    ->defaultRange("This Quarter")
                    ->ranges([
                        "This Month"=>ValueMetric::thisMonth(),
                        "This Quarter"=>ValueMetric::thisQuarter(),
                        "This Year"=>ValueMetric::thisYear(),
                    ]),

                ValueMetric::create("customTitleForValue")->width(1/3)
                    ->title("Custom Title")
                    ->type("danger")
                    ->defaultRange("This Year")
                    ->ranges([
                        "This Month"=>ValueMetric::thisMonth(),
                        "This Quarter"=>ValueMetric::thisQuarter(),
                        "This Year"=>ValueMetric::thisYear(),
                    ]),
            ]),


        ]),
        Panel::create()->header("Trend Metrics")->sub([
            Row::create([
                TrendMetric::create("normalTrend")->width(1/3)
                    ->defaultRange("This Week")
                    ->type("primary"),
                TrendMetric::create("customRangeForTrend")->width(1/3)
                    ->type("warning")
                    ->title("Custom Range")
                    ->defaultRange("This Month")
                    ->ranges([
                        "This Month"=>ValueMetric::thisMonth(),
                        "This Quarter"=>ValueMetric::thisQuarter(),
                        "This Year"=>ValueMetric::thisYear(),
                    ]),
                TrendMetric::create("customTitleForTrend")->width(1/3)
                    ->type("success")
                    ->title("Custom Title")
                    ->defaultRange("This Year")
                    ->ranges([
                        "This Month"=>ValueMetric::thisMonth(),
                        "This Quarter"=>ValueMetric::thisQuarter(),
                        "This Year"=>ValueMetric::thisYear(),
                    ]),
            ])
        ]),
        Panel::create()->header("Category Metrics")->sub([
            Row::create([
                CategoryMetric::create()
                    ->title("status")
                    ->type("primary")
                    ->width(1/3),
                CategoryShowTop::create()->width(1/3)
                    ->title("Status")
                    ->type("warning"),
                CategoryShowTop::create("changePieSize")
                    ->title("Status")
                    ->width(1/3)
                    ->pieSize(110)
                    ->type("success"),
            ])
        ]),
        \demo\CodeDemo::create("
            The example shows 3 types of metrics: <b>Value</b>, <b>Trend</b> and <b>Category</b>.
            The Value metrics shows the summary number over a period with comparision to the previous.
            The Trend metrics shows the moving trend of value within a period.
            While the Category metrics shows the comparison among category.
        ")->raw(true)
    ];
}
}
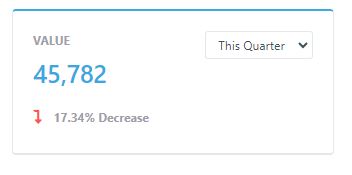
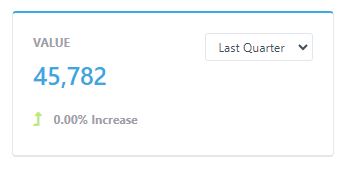
above screenshot we have selected "this quarter" and "last quarter" date range, the output metrics values are same but the increase and decrease percentage values are different. so finally values are not matching. something wrong in the "quarter" daterange related. please look in the issue.
Build Your Excellent Data Report
Let KoolReport help you to make great reports. It's free & open-source released under MIT license.
Download KoolReport View demo