Hi there,
I'm trying to generate this attached sort of chart.
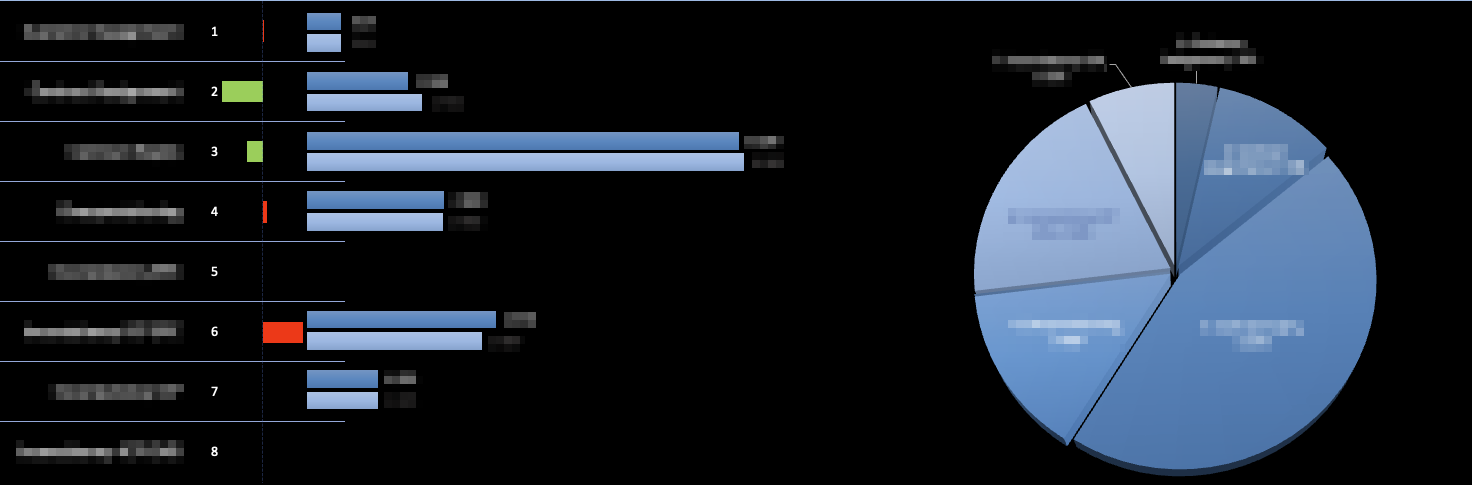
- The data sits in an mysql database
- There are horizontal bars that show
- in darker blue: current period's data
- in lighter blue: last period's data
- left of it a delta view, i.e., the change between two periods
- there are data labels on the bart chart (to the right of the bars)
there's a pie chart of the current period
each slice of the pie and each bar should be clickable so as to parameterize the next report (drill down)
- the whole report should be parameterizable via URL
- the whole report should be exportable e.g. to pdf or png
- I need caching behind on top of the database (possible to use memcached?)
- what kind of authentication options are available?
Thanks!