KoolReport's Forum

Official Support Area, Q&As, Discussions, Suggestions and Bug reports.
Forum's Guidelines

Google columns chart stacked #2491

Open Francois DISSAIT opened this topic on on Dec 14, 2021 - 7 comments

Francois DISSAIT commented on Dec 14, 2021

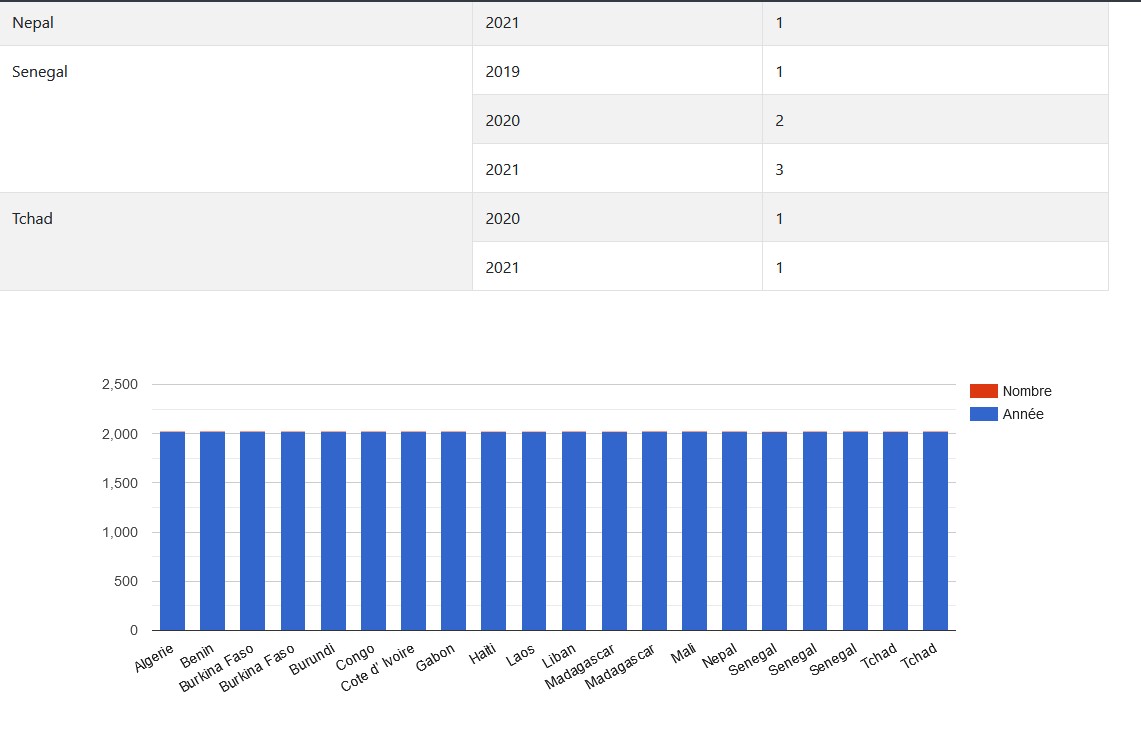
Hello, from a SQL data table, I query "pays", and 'date" I have them grouped by "pays" and "year" and number in groups. It's OK with table presentation, but I cannot obtain a column chart with pays on x axis, and stacked number of each year data.

Here are the files : ActionsParPaysetAnnee :

<?php

require_once "../../../load.koolreport.php";

use \koolreport\processes\Group;
use \koolreport\processes\Sort;
use \koolreport\processes\Limit;
use \koolreport\processes\Map;


class ActionsParPaysetAnnee extends \koolreport\KoolReport
{
  
  public function settings()
    {
        $config = include "../../../config.php";

        return array(
            "dataSources"=>array(
                "phamm"=>$config["phamm"]
            )
        );
    }

  
  function setup()
  {
       $this->src('phamm')
        ->query("
		SELECT 
		count(expeditions.id) AS Nombre,
		year(expeditions.date_expedition) AS Annee,
		expeditions.pays AS Pays
		FROM
		expeditions     
		WHERE
		expeditions.pays <> 'France'   
		GROUP BY Pays, Annee
			")
   		->pipe(new \koolreport\processes\Map(array(
		"{meta}" => function($meta) {
			foreach ($meta["columns"] as $colName => $colMeta) {
            $meta["columns"][$colName]["thousandSeparator"] = "";
            $meta["columns"][$colName]["decimalPoint"] = "";
        }
        return $meta;
    }
))) 
       ->pipe($this->dataStore('actionspaysannee'));
  }
}

__ActionsParPaysetAnnee.view__

<?php 
    use \koolreport\widgets\koolphp\Table;
	use \koolreport\widgets\google\ColumnChart;
  
?>

<div class="report-content">
    <div class="text-center">
        <h1>Actions par pays</h1>
        <p class="lead">Evolution annuelle des actions par pays</p>
    </div>
  <?php
    Table::create(array(
        "dataStore"=>$this->dataStore('actionspaysannee'),
		"sorting"=>array(
			"Pays"=>"asc",
			"Annee"=>"asc",
			),
        "columns"=>array(
            "Pays"=>array(
                "label"=>"Pays"
            ),
			"Annee"=>array(
				"label"=>"Année"
			),
            "Nombre"=>array(
                "type"=>"number",
                "label"=>"Nombre",                
            )
        ),
        "cssClass"=>array(
            "table"=>"table table-bordered table-striped"
        ),
		"removeDuplicate"=>array("Pays"),
    ));
    ?>
	   <div style="margin-bottom:50px;">
    <?php  
        ColumnChart::create(array(
            "dataStore"=>$this->dataStore('actionspaysannee'),
		"columns"=>array(
			"Pays",
            "Annee"=>array(
                "label"=>"Année"          
			),
            "Nombre"=>array(
                "type"=>"number",
                "label"=>"Nombre",                
            )
        ),
        "options"=>array(
            "isStacked"=>true
        )
    ));
    ?>
    </div>
    <?php
   
    ?>


</div>

What is wrong with my data in chart ?

Thanks

Francois DISSAIT commented on Dec 14, 2021

Hear is the actionspparpaysetannées .view file

<?php 
    use \koolreport\widgets\koolphp\Table;
	use \koolreport\widgets\google\ColumnChart;
  
?>

<div class="report-content">
    <div class="text-center">
        <h1>Actions par pays</h1>
        <p class="lead">Evolution annuelle des actions par pays</p>
    </div>
  <?php
    Table::create(array(
        "dataStore"=>$this->dataStore('actionspaysannee'),
		"sorting"=>array(
			"Pays"=>"asc",
			"Annee"=>"asc",
			),
        "columns"=>array(
            "Pays"=>array(
                "label"=>"Pays"
            ),
			"Annee"=>array(
				"label"=>"Année"
			),
            "Nombre"=>array(
                "type"=>"number",
                "label"=>"Nombre",                
            )
        ),
        "cssClass"=>array(
            "table"=>"table table-bordered table-striped"
        ),
		"removeDuplicate"=>array("Pays"),
    ));
    ?>
	   <div style="margin-bottom:50px;">
    <?php  
        ColumnChart::create(array(
            "dataStore"=>$this->dataStore('actionspaysannee'),
		"columns"=>array(
			"Pays",
            "Annee"=>array(
                "label"=>"Année"          
			),
            "Nombre"=>array(
                "type"=>"number",
                "label"=>"Nombre",                
            )
        ),
        "options"=>array(
            "isStacked"=>true
        )
    ));
    ?>
    </div>
    <?php
   
    ?>


</div>
Sebastian Morales commented on Dec 14, 2021

In your chart pls move the "Annee" column to the first place and "Pays" and "Nombre" columns to the second and third places. For chart in general label column should be the first column and data columns the later ones. Let us know if it solves your problem. Rgds,

Francois DISSAIT commented on Dec 14, 2021

Thanks a lot Sebastian, I did the move, but if I do this, i get a red notice : "All series on a given axis must be of the same data type" Rgds

Sebastian Morales commented on Dec 15, 2021

We should probably set the column meta type explicitly like this:

function setup()
{

->pipe(new \koolreport\processes\ColumnMeta(array(
    "Annee" => array("type" => "string"),
    "Pays" => array("type" => "number"),
    "Nombre" => array("type" => "number"),
)))
->pipe(new \koolreport\processes\TypeAssure()) // convert column values using their meta type
->pipe($this->dataStore('actionspaysannee'));

}
Francois DISSAIT commented on Dec 15, 2021

Thanks a lot Sebastian, I thought about change the type of data. I did It Here is function setup, as you telle me :

function setup()
  {
       $this->src('phamm')
        ->query("
		SELECT 
		count(expeditions.id) AS Nombre,
		year(expeditions.date_expedition) AS Annee,
		expeditions.pays AS Pays
		FROM
		expeditions     
		WHERE
		expeditions.pays <> 'France'   
		GROUP BY Pays, Annee
			")
   		->pipe(new \koolreport\processes\Map(array(
		"{meta}" => function($meta) {
			foreach ($meta["columns"] as $colName => $colMeta) {
            $meta["columns"][$colName]["thousandSeparator"] = "";
            $meta["columns"][$colName]["decimalPoint"] = "";
        }
        return $meta;
		}
		))) 
		->pipe(new \koolreport\processes\ColumnMeta(array(	
		"Annee" => array("type" => "number"),	
		"Pays" => array("type" => "string"),
		"Nombre" => array("type" => "number"),
		
		)))
		->pipe(new \koolreport\processes\TypeAssure()) // convert column values using their meta type
       ->pipe($this->dataStore('actionspaysannee'));
  }

And in .view,

<?php 
    use \koolreport\widgets\koolphp\Table;
	use \koolreport\widgets\google\ColumnChart;
  
?>

<div class="report-content">
    <div class="text-center">
        <h1>Actions par pays</h1>
        <p class="lead">Evolution annuelle des actions par pays</p>
    </div>
  <?php
    Table::create(array(
        "dataStore"=>$this->dataStore('actionspaysannee'),
		"sorting"=>array(
			"Pays"=>"asc",
			"Annee"=>"asc",
			),
        "columns"=>array(
            "Pays"=>array(
                "label"=>"Pays"
            ),
			"Annee"=>array(
				"label"=>"Année"
			),
            "Nombre"=>array(
                "type"=>"number",
                "label"=>"Nombre",                
            )
        ),
        "cssClass"=>array(
            "table"=>"table table-bordered table-striped"
        ),
		"removeDuplicate"=>array("Pays"),
    ));
    ?>
	   <div style="margin-bottom:50px;">
    <?php  
        ColumnChart::create(array(
            "dataStore"=>$this->dataStore('actionspaysannee'),
		"columns"=>array(	
			"Annee"=>array(
				"label"=>"Année"
			),		
            "Pays"=>array(
                "label"=>"Pays" 
			),			
            "Nombre"=>array(               
                "label"=>"Nombre"
			)        
      
        ),
        "options"=>array(
            "isStacked"=>true
        )
    ));
    ?>
    </div>
     
</div>

You can see the result here :

.

I think I do not affect the good coolumn to x an Y axis. I want On X axis : Pays and Annee (must be number type ?) side by side or Stacked (preferred) On Y axis : Number ... Is the datastore badly built ?

Your help is very appreciated. Have a good day Francois

Sebastian Morales commented on Dec 15, 2021

It's great to see you make it work. However, I think we could pipe the data through a Cube process before displaying it in chart:

$this->src(...)
->query(...)
...
->pipe(new \koolreport\cube\processes\Cube(array(
    "row" => "Pays",
    "column" => "Annee",
    "sum" => "Nombre"
)))
->pipe(new \koolreport\processes\RemoveColumn(array(
    "{{all}}" // keep only individual Annee columns, remove column "{{all}}" sum of all Annees
)))
->pipe($this->dataStore('actionspaysanneeForChart'));

Then in your report view:

    Table::create(array(
        "dataStore"=>$this->dataStore('actionspaysanneeForChart'),
    ));

        ColumnChart::create(array(
            "dataStore"=>$this->dataStore('actionspaysanneeForChart'),
	    "columns"=>array(	
			"Pays"=>array(
				"label"=>"Pays"
			),
                        "2019", "2020", "2021"
            ),
        "options"=>array(
            "isStacked"=>true
        )
    ));

Let us know the result and if you're happy with it. Tks,

Francois DISSAIT commented on Dec 15, 2021

Sebastian, It works great. Thanks a lot. François

Build Your Excellent Data Report

Let KoolReport help you to make great reports. It's free & open-source released under MIT license.

Download KoolReport View demo
help needed
solved

None