In this tutorial, I would like to show you how to set up instant widget with datasource so that you can visualize your data without setting up a full report.
We will display a ColumnChart from data from database
<?php
require_once "../koolreport/autoload.php";

//Use PDO DataSource
use \koolreport\datasources\PdoDataSource;

//Process data
use \koolreport\processes\TimeBucket;
use \koolreport\processes\Group;

//Visualize
use \koolreport\instant\Widget;
use \koolreport\widgets\google\ColumnChart;

//Create datasource
$dataSource = new PdoDataSource(array(
    "connectionString"=>"mysql:host=localhost;dbname=sakila",
    "username"=>"root",
    "password"=>"",
    "charset"=>"utf8"
));
?>

<html>
    <head>
        <title>Instant graphs with database</title>
    </head>
    <body>
        <?php
        Widget::create(ColumnChart::class,array(
            "dataSource"=>(
                $dataSource->query("SELECT payment_date,amount FROM payment")
                ->pipe(new TimeBucket(array(
                    "payment_date"=>"month"
                )))
                ->pipe(new Group(array(
                    "by"=>"payment_date",
                    "sum"=>"amount"
                )))
            ),
        ));
        ?>
    </body>
</html>
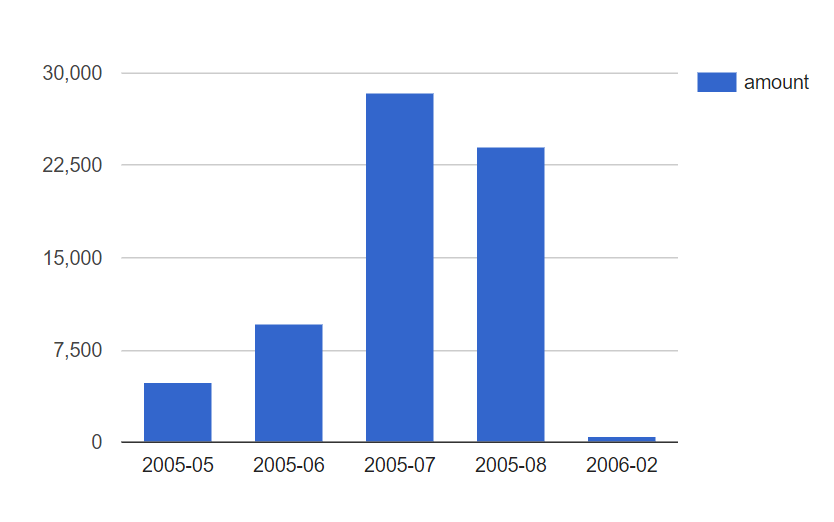
Result:
The flow is very simple that we require the koolreprt autoload and specify all classes that we will use. We will use PdoDataSource to connect to database and two processes TimeBucket and Group to transform data. At visualization state, we use Widget of instant package to load ColumnChart.