KoolReport's Forum
Official Support Area, Q&As, Discussions, Suggestions and Bug reports.
Forum's Guidelines
Koolreport datatables add progress bar along with text #1701
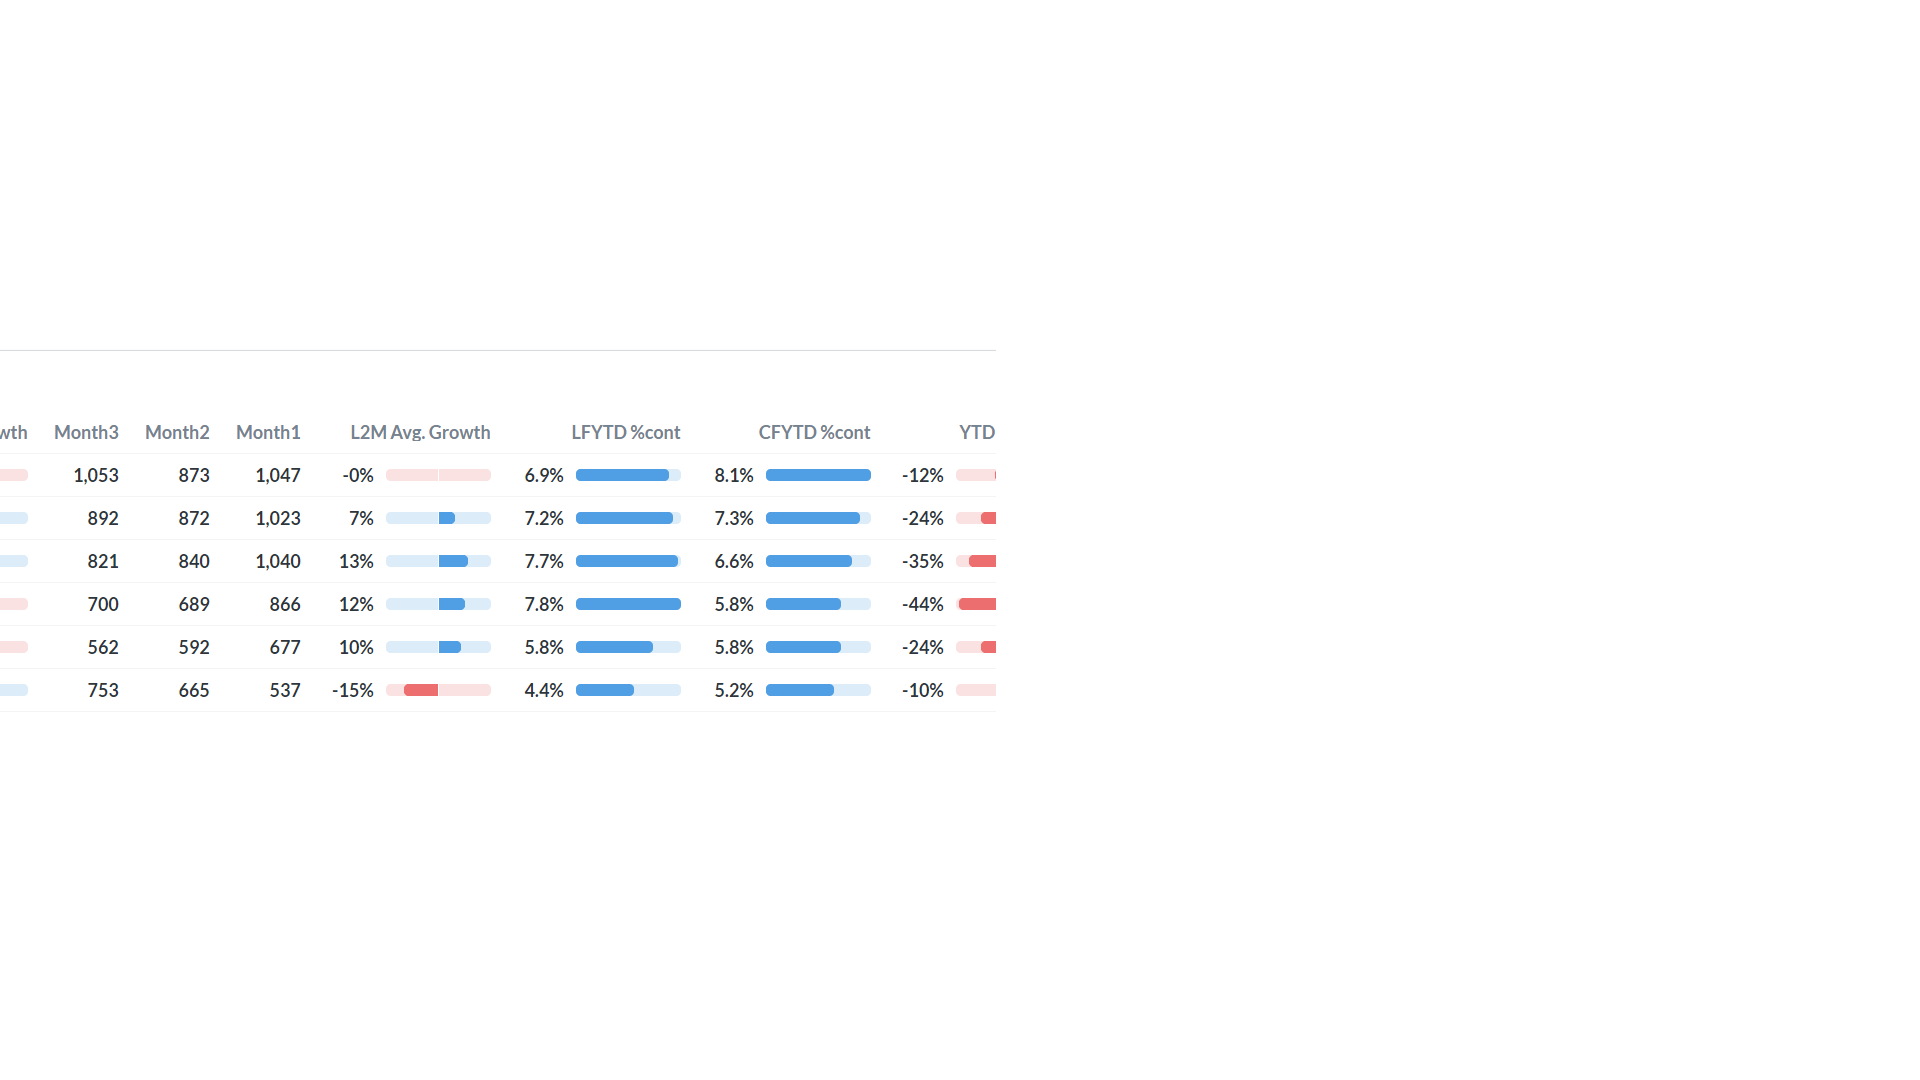
Ankit, you could try DataTables' "formatValue" property like in this example:
https://www.koolreport.com/examples/reports/sparklines/datatables_sparklines/
DataTables::create(array(
        "columns"=>array(
            'SparkBar' => [
                'formatValue' => function($val, $row) {
                    $data = [$row['Q 1'], $row['Q 2'],
                        $row['Q 3'], $row['Q 4']];
                    return sparklines\Bar::create(array(
                        "data" => $data,
                    ));
                }
            ],
But instead of sparklines' chart, use html5's progress tag:
https://developer.mozilla.org/en-US/docs/Web/HTML/Element/progress
Thanks , i was able to get the graph , but the sorting is happening incorrect for negative values, any work around for that?
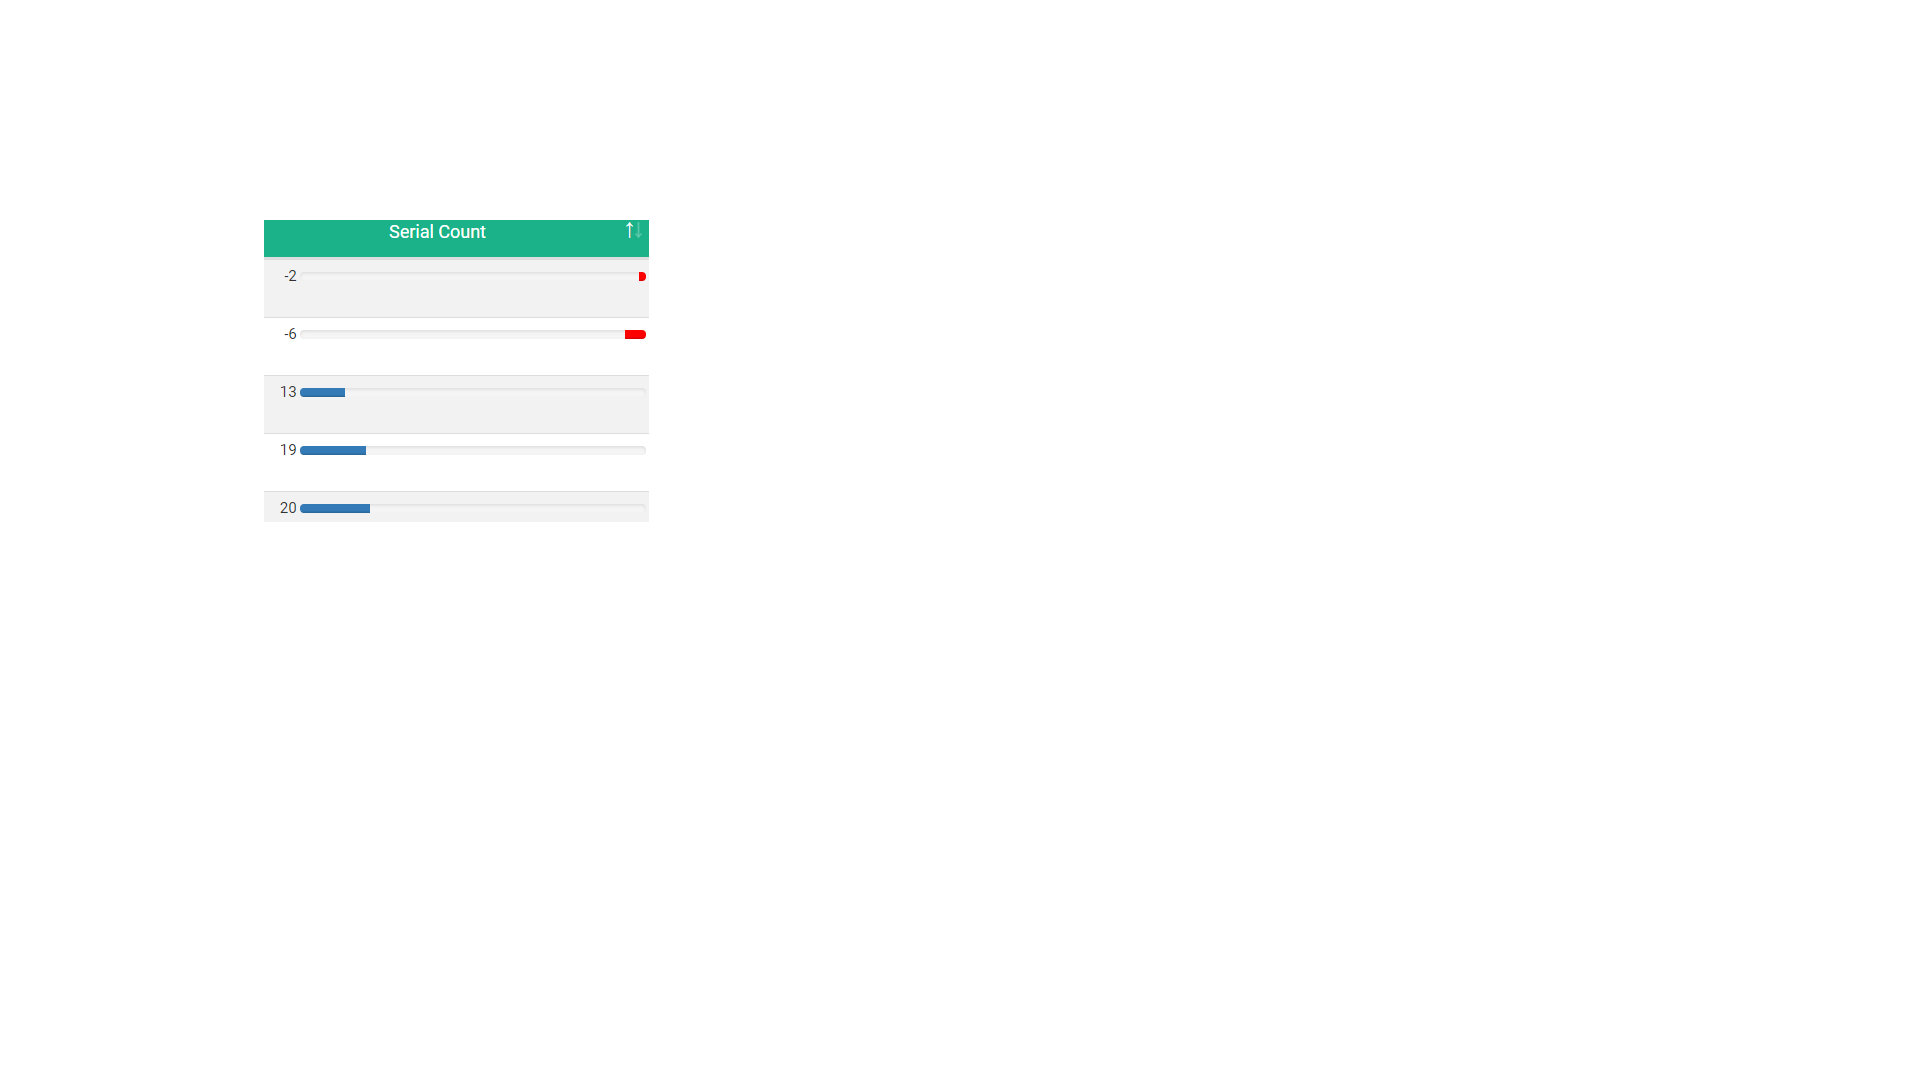
-2 is coming before -6 in ascending order , this is the code:
"columns"=>[
$name=>[
"footerText"=>"Total"
],
"Serial Count"=>[
'formatValue'=>function($value,$row){
$neg_pos = abs($value);
$text_label = '<span>'.$value.' </span>';
if($value < 0) {
return $text_label . '<div class="progress" style="display:inline-flex;height:6px;width:90%;flex-direction: row-reverse">
<div class="progress-bar" style="width:' . $neg_pos . '%;background-color:red;"></div>
</div>';
            }
        else{
            return $text_label.'<div class="progress" style="display:inline-flex;height:6px;width:90%;">
<div class="progress-bar" style="width:'.$value.'%"></div>
</div>';
        }
        }
Thanks , i was able to get the graph , but the sorting is happening incorrect for negative values, any work around for that?
-2 is coming before -6 in ascending order , this is the code:
"columns"=>[
$name=>[
"footerText"=>"Total"
],
"Serial Count"=>[
'formatValue'=>function($value,$row){
$neg_pos = abs($value);
$text_label = '<span>'.$value.' </span>';
if($value < 0) {
return $text_label . '<div class="progress" style="display:inline-flex;height:6px;width:90%;flex-direction: row-reverse">
<div class="progress-bar" style="width:' . $neg_pos . '%;background-color:red;"></div>
</div>';
            }
        else{
            return $text_label.'<div class="progress" style="display:inline-flex;height:6px;width:90%;">
<div class="progress-bar" style="width:'.$value.'%"></div>
</div>';
        }
        }
Build Your Excellent Data Report
Let KoolReport help you to make great reports. It's free & open-source released under MIT license.
Download KoolReport View demo