KoolReport's Forum

Official Support Area, Q&As, Discussions, Suggestions and Bug reports.
Forum's Guidelines

Marker GeoCharts doesn't work properly #1513

Open bor opened this topic on on Jul 6, 2020 - 1 comments

bor commented on Jul 6, 2020

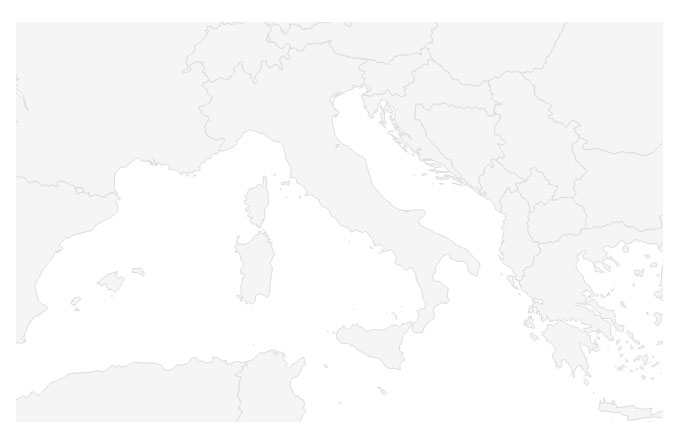
Hi, I got a connection to \koolreport\widgets\google\GeoChart but The markers don't appear on the map.

(I created my API credentials from Google Cloud Platform)

this is the code on my Myreport.view.php

\koolreport\widgets\google\GeoChart::create([

"title"=>"World Polulation 2016",
"dataSource"=>[
    ['City',   'Population', 'Area'],
    ['Rome',      2761477,    1285.31],
    ['Milan',     1324110,    181.76],
    ['Naples',    959574,     117.27],
    ['Turin',     907563,     130.17],
    ['Palermo',   655875,     158.9],
    ['Genoa',     607906,     243.60],
    ['Bologna',   380181,     140.7],
    ['Florence',  371282,     102.41],
    ['Fiumicino', 67370,      213.44],
    ['Anzio',     52192,      43.43],
    ['Ciampino',  38262,      11]
],
'mapsApiKey'=> 'xxxxxxxxxxxxxxxxxx',
"options"=>[
    "region"=>'IT',
    "displayMode" => 'markers',
    "colorAxis" => ["colors"=> ['green', 'blue']]
]

]);

pargibay commented on Jul 13, 2020

Hi Bor, I think you must indicate column name and values like this example:

GeoChart::create(array(
        "title"=>"World Polulation 2016",
        "dataSource"=>$this->dataStore("population2016"),
        "columns"=>array(       __ //<=====__
            "Country Name",      __ //<=====__ (City )
            "Value"=>array(       __ //<=====__ (population)
                "type"=>"number",
                "label"=>"Polulation 2016"
            )
        ),
    ));

Build Your Excellent Data Report

Let KoolReport help you to make great reports. It's free & open-source released under MIT license.

Download KoolReport View demo
None yet

None