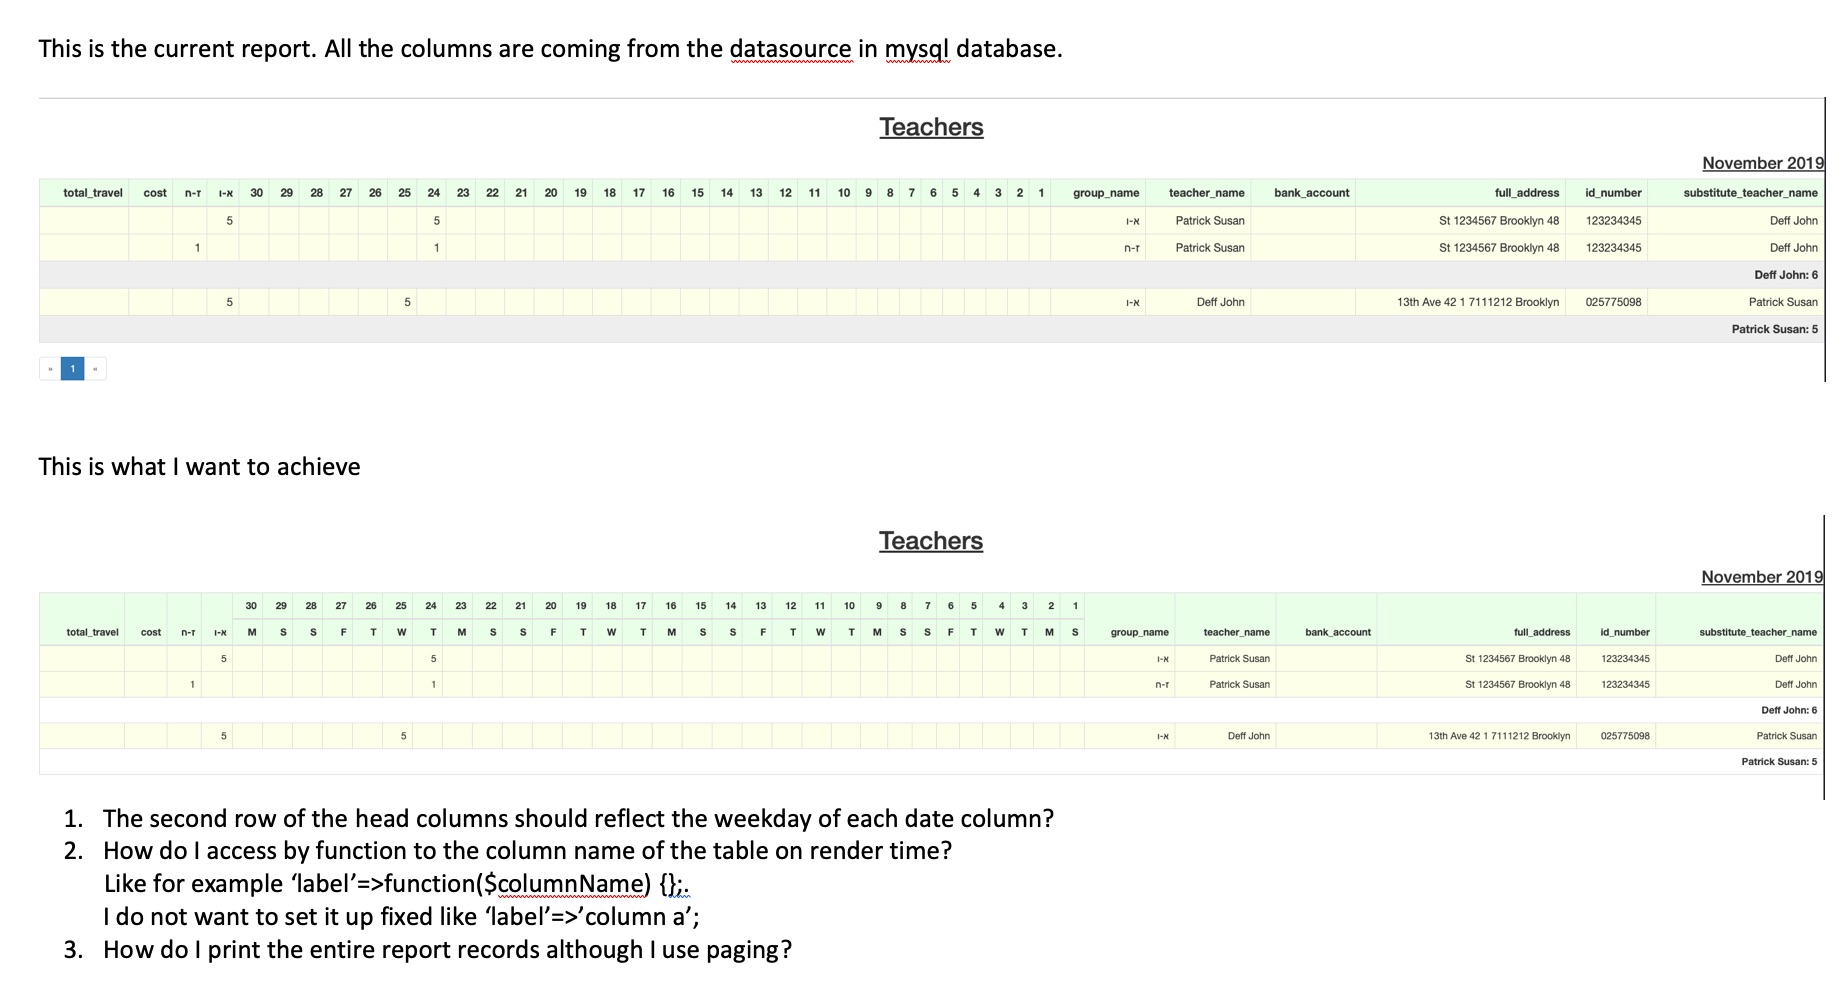
DataTables::create(array(
"dataSource"=>$this->dataStore("st"),
"options"=>array(
"searching"=>false,
"paging"=>false,
'columnDefs' => array(
array(
'visible' => false,
'targets' => [37], //hide the first column
)
),
'rowGroup' => [
'dataSrc' => [0], //10 is the order of the column you want to group
'endRender' => "function ( rows, group ) {
var salaryAvg = rows
.data()
.pluck(5) //5 is the order of the salary column
.reduce( function (a, b) {
return a + b.replace(/[^\d]/g, '')*1;
}, 0) / rows.count();
salaryAvg = $.fn.dataTable.render.number(',', '.', 0, '$').display( salaryAvg );
return $('<tr/>')
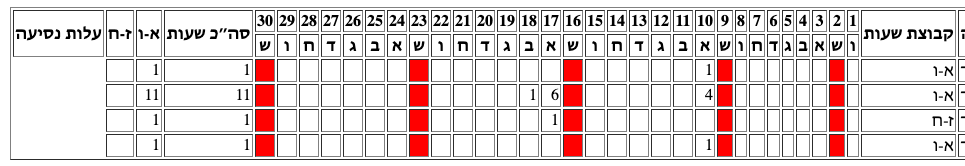
.append( '<td colspan=39>סה״כ שעות מילוי מקום למורה '+group+'</td>' )
.append( '<td/>' )
.append( '<td>'+salaryAvg+'</td>' );
}"
],
),
'complexHeaders' => true,
'headerSeparator' => ' - ',
'cssClass'=>array(
'table'=>'table table-hover table-bordered',
'tr'=>'cssItem',
'td'=>function($row,$colName)
{
return in_array($colName, array('substitute_teacher_id','id_number','full_address','bank_account','teacher_id','group_name')) ? 'cssItem rext-right' : 'cssItem text-center';
},
'th'=>function($colName)
{
return in_array($colName, array('substitute_teacher_id','id_number','full_address','bank_account','teacher_id','group_name')) ? 'cssHeader text-right' : 'cssHeader text-center';
},
),
))