Drill Down and Drill Through Report in Advanced Data Reporting
January 16, 2018Drill down and drill through are two extremely powerful features in business intelligence. They both give the user the ability to see data and information in more detail–although they do so in different fashions.
Drill Down
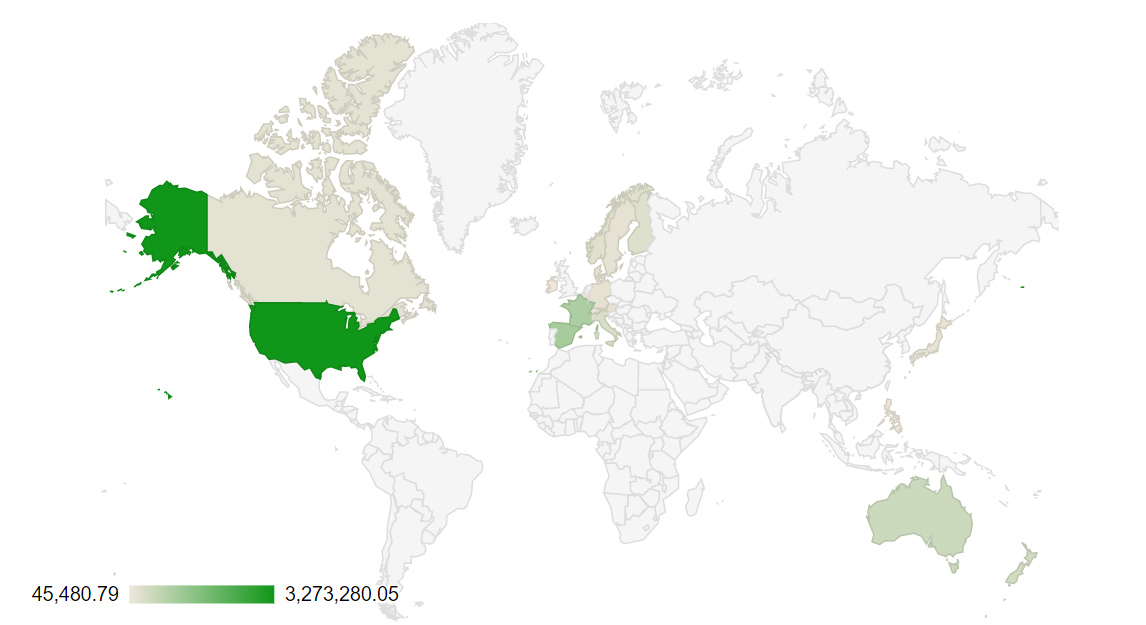
Drill down is a capability that takes the user from a more general view of the data to a more specific one at the click of a mouse. For example, a report that shows sales revenue by state can allow the user to select a state, click on it and see sales revenue by county or city within that state. It is called “drill down” because it is a feature that allows the user to go deeper into more specific layers of the data or information being analyzed.
Further levels of drill down can be set up within the report–practically as many as supported by the data. In our example, the drill-down can go from country to state to city to zip code to specific location of stores or individual sales reps. Typically, the look and feel of each level of the report is similar–what changes is the granularity of the data.
Drill Through (MultiView)
Instead of taking the user to a more granular level of the data, drill through takes him to a report that is relevant to the data being analyzed, also at the click of a mouse. For example, a tabular report that shows sales revenue by state can allow the user to click on it and reveal an analysis grid of the same data, or a heat map representing the data in visual form. It is called “drill through” because it is a feature that allows the user to pass from one report to another while still analyzing the same set of data.
Benefits of Drill Down and Drill Through
Gain instant knowledge of different depths of the data – Drill down gives the user a deeper insight of the data by letting him see what makes up the figures he’s analyzing. For example, in mere seconds, drill-down answers questions such as: of my National sales figure, which states are performing better? Which states are underperforming? And within each state, which territories are driving revenue?
See data from different points of view – Drill through allows users to analyze the same data through different reports, analyze it with different features and even display it through different visualization methods. This greatly enhances the users’ understanding of the data and of the reasons behind the figures.
Keep reporting load light and enhance reporting performance – By only presenting one layer of data at a time, features like drill down lighten the load on the server at query time and greatly enhance reporting performance–while offering great value to the end-user.
<3 koolreport team